Pull a real production log from loghub.
Ingest 12 GiB into Xerj with one CLI command. Query it from Xerj Console.
Each step shows the Elasticsearch alternative — resources, time, config —
sourced from collected community feedback
(G2, Gartner, TrustRadius, GitHub issues, Reddit, HN, Jepsen, CVE).
6.01 M
docs/sec · burst (in-memtable)
410 K
docs/sec · segment-durable
47 ms
cold start (median, 5 runs)
519 MB
RSS · 655 K-doc index
3.3×
disk smaller than raw
1305 / 1329
ES YAML conformance · 2026-04-27 snapshot (current: 1,366 / 1,369)
Every number above + every CLI block on this page was captured live on this
machine on 2026-04-27 against the
v1.0.0-rc.1 binary (commit 78a9bcc). Full
transcript: demo/CLI_VALIDATED_2026-04-27.md.
·What's loaded — real vs reproducible synthetic
The demo blends three kinds of data, and we call out which-is-which on
every panel. No JS-hardcoded mock dressed up as live numbers — every
Xerj Console dashboard's status pill says either LIVE · XERJ
(data fetched from the running engine on localhost:9200)
or MOCK FALLBACK (the live adapter for that view
isn't wired yet).
Real, captured
logs-ssh-auth
50,000 docs
logpai/loghub OpenSSH server log capture (LabSZ host, 2017, 73 MB raw, 655 K real lines; demo ingests the first 50 K with timestamps shifted to the last 24 h)
ai-kb
40 docs
Hand-authored RAG knowledge base — eight topic axes, 8-dim cosine embeddings. Real text and real vectors, just small.
Reproducible synthetic (random.seed(42) ⇒ byte-identical on any machine)
chat-events
4,005 docs
LLM query telemetry — drives the AI · OVERVIEW and RAG · QUALITY dashboards
vector-ops
4,000 docs
Vector index ops (knn-search / upsert / delete) — drives VECTOR · INDEX
Distributions are loosely modelled on typical enterprise LLM-ops
shape (model mix, ~42 % cache hit rate, ~1.2 % error rate,
diurnal QPS curve peaking around 13 UTC); no record corresponds
to any real customer. We use synthetic for these five indices
because no real LLM-traffic capture ships with the repo, and the
AI / vector / agent / anomaly / ingest dashboards need that shape
to render meaningfully. Generator:
demo/data/extras/generate_demo_corpus.py.
The rule a buyer hears, consistently across every panel: "The only
real captured data in this demo is the 40-doc ai-kb
corpus we authored and the 50 K loghub OpenSSH log capture. The
five LLM/vector/agent/anomaly/ingest indices are synthetic with a
fixed seed so two SEs see byte-identical numbers — but the rendering
is always live; every panel queries the running engine."
01Get + start Xerj
Three commands. No JVM tuning, no cluster.yml, no Filebeat
sidecars. The banner ends with Started in 4ms and the UI
is already running on port 9200.
$ (
    ver=1.0.0-rc.1                              # this demo was captured on rc.1
    stage="xerj-${ver}-x86_64-unknown-linux-gnu"
    asset="${stage}.tar.gz"
    base="https://github.com/xerj-org/xerj/releases/download/v${ver}"

    curl -fsSLO "$base/$asset"
    curl -fsSLO "$base/$asset.sha256"

    want=$( { sha256sum "$asset" 2>/dev/null || shasum -a 256 "$asset"; } | cut -d ' ' -f 1 )
    printf %s "$want" | LC_ALL=C grep -qE '^[0-9a-f]{64}$' \
      || { echo "no working SHA-256 tool — refusing to run an unverified $asset" >&2; exit 1; }

    tr -d '\r' < "$asset.sha256" \
      | LC_ALL=C grep -qxF -e "$want  $asset" -e "$want *$asset" \
      || { echo "CHECKSUM MISMATCH for $asset — do not run it" >&2; exit 1; }

    tar xzf "$asset" && mv "$stage/xerj" ./xerj
  )
$ ./xerj --insecure --data-dir ./data
2026-04-27T19:11:41.6Z  INFO xerj: xerj v1.0.0-rc.1 starting
2026-04-27T19:11:41.6Z  WARN xerj: --insecure: TLS and auth disabled
2026-04-27T19:11:41.6Z  INFO xerj: Cluster mode disabled — running in single-node mode
2026-04-27T19:11:41.7Z  INFO xerj_console_api::bootstrap: generated xerj-console master key path="./data/.xerj_master_key"
2026-04-27T19:11:41.7Z  INFO xerj_storage::wal: no checkpoint found, replaying from generation 0
…  (one such line per index — system indices: .xerj_users, _passkeys, _sessions, _prefs, …)
2026-04-27T19:11:41.7Z  INFO xerj_console_api::magic_link: bootstrap link minted token_hash=… ttl=1800s

┌──────────────────────────────────────────────────────────────────────────────┐
│ XERJ CONSOLE  ·  first-launch setup                                                │
│                                                                              │
│ Open this link in your browser to claim the owner account by                 │
│ enrolling a passkey.  Valid for 30 minutes.  Single use.                     │
├──────────────────────────────────────────────────────────────────────────────┤
  http://localhost:9200/_xerj-console/setup#token=T8AC0tmun3Ca-DNrepOawL42uOZaDSTkXBoFI6TIPZg
├──────────────────────────────────────────────────────────────────────────────┤
│                                                                              │
│ Need a fresh link?  `xerj admin magic-link --role owner`                    │
└──────────────────────────────────────────────────────────────────────────────┘
$ # From a second shell — first /_cluster/health 200 in 47 ms (median of 5 cold-boots, 5ms poll)
$ curl -s localhost:9200/_cluster/health | jq .status
"green"
Xerj · single binary
47 ms
cold start to first 200 (median of 5 fresh-dir boots).
519 MB RSS after 655 K-doc ingest, 22 MB binary, zero config files,
UI bundled in. Single-shell startup also prints the magic-link banner
for first-run passkey enrolment.
measured: this machine · 2026-04-27 · transcript §11
Elasticsearch 8.13 · production
6+ s · 4-31 GB heap
JVM cold start, plus jvm.options + elasticsearch.yml + log4j2.properties; 50-70 % of RAM consumed by JVM heap; 33 GB RAM consumed on empty install ("Forum: JorgeCarousel"); needs Kibana for UI (separate process, separate config).
Pause on the Started in 4 ms line — the entire JVM-cold-start
argument lands visually. The "Xerj Console UI · 36 files bundled" line is your
transition to step 2: the UI is already up, no second download.
02The data
Real production OpenSSH server logs from loghub
(LabSZ host, Dec 2017, 28 days, 71 MB raw / 655 K lines).
Brute-force attempts, "Failed password for invalid user", reverse-DNS spoofing.
Replicated 93× to a 12 GiB / 60.9 M-doc NDJSON corpus to push the engine.
$ head -3 SSH.log
Dec 10 06:55:46 LabSZ sshd[24200]: reverse mapping checking getaddrinfo for ns.marryaldkfaczcz.com [173.234.31.186] failed - POSSIBLE BREAK-IN ATTEMPT!
Dec 10 06:55:46 LabSZ sshd[24200]: Invalid user webmaster from 173.234.31.186
Dec 10 06:55:48 LabSZ sshd[24200]: Failed password for invalid user webmaster from 173.234.31.186 port 38926 ssh2$ python3 build_corpus.py
[1/2] parse SSH.log → ssh_one.ndjson
655,147 docs · 132.5 MiB · 2.4s
[2/2] replicate ×93 → ssh_big.ndjson (target 12288 MiB)
12,321.0 MiB · 60,928,671 docs · 3.7s
Ready: /home/claude/ai/xerj/engine/demo-data/ssh_big.ndjson
Each line becomes a typed JSON document:
@timestamp · host · proc · pid · event · user · src_ip · src_port · message.
Event tags (auth_failure_invalid_user, possible_break_in,
auth_success, …) come from a small regex parser
(build_corpus.py).
This is the part you skip on most demos — "real data" usually means a 100-line
sample. Here you can show the actual brute-force IPs in the file
(173.234.31.186, 52.80.34.196 …) before you even start the engine. That is
what a SIEM customer wants to know they can search.
03CLI ingest · 12 GiB → segments
xerj index mmaps the file, finds newline boundaries with rayon,
streams batches straight into the engine — bypasses HTTP, bypasses axum, no
per-batch JSON response serialisation. This is the fastest ingest
path on the box. Two scales below: the 1-million-doc burst (memtable-only
— what "burst rate" means) and the 60-million-doc continuous (what
"sustained" means once flushes hit the disk).
Burst — 655 K real lines in 0.11 s · validated 2026-04-27
$ ./xerj index --index ssh-auth --file demo-data/ssh_one.ndjson \
       --workers 8 --batch 5000 --data-dir ./data
…  (200+ tracing lines — WAL checkpoints, segment flushes, FTS index builds)

═══════════════════════════════════════════════════════════
 xerj index: complete
═══════════════════════════════════════════════════════════
 index          : ssh-auth
 file           : demo-data/ssh_one.ndjson
 file size      : 132 MB
 docs sent      : 655147
 errors         : 0
 ingest time    : 0.11 s
 ingest rate    : 6008939 docs/s   (WAL-durable, in-memtable)
 final flush    : 1.49 s
 total elapsed  : 1.60 s
 total rate     : 409809 docs/s      (fully segment-durable)
 workers        : 8
 batch size     : 5000
═══════════════════════════════════════════════════════════
Sustained scale — full 60.9 M / 12 GiB
Output below is from the 2026-04-25 head-to-head bench
(commit 73c6367, pre-rc). We did not re-run the 22-minute 60 M ingest
on 2026-04-27 — burst rate above is the only ingest measurement
re-validated against rc.1. Reproduce with
python3 build_corpus.py && ./xerj index --index ssh-auth --file ssh_big.ndjson.
$ ./xerj index --index ssh-auth --file ssh_big.ndjson \
       --workers 8 --batch 10000 --data-dir ./data
[ 156.2s] sent= 13,900,000 errs=0 win_rate=     88,971/s
[ 264.4s] sent= 18,510,000 errs=0 win_rate=     43,213/s
[ 697.2s] sent= 37,990,000 errs=0 win_rate=     45,008/s
[ 893.8s] sent= 46,160,000 errs=0 win_rate=     41,570/s
═══════════════════════════════════════════════════════════
 xerj index: complete
 docs sent      : 60,928,671
 errors         : 0
 ingest time    : 1206.65 s
 ingest rate    : 50,494 docs/s     (sustained, segment-durable)
 final flush    :   99.78 s
 total elapsed  : 1306.43 s
═══════════════════════════════════════════════════════════
Burst is what the engine does when ingest fits in the
memtable — that is what "millions per second" means. Sustained
on a single NVMe SSD is bounded by compress + fsync throughput
of the underlying disk; ~50 K docs/s on the 60 M run equals ~7 MiB/s of
segment write, in line with the disk's measured bandwidth. Burst is
reproducible against the loghub OpenSSH dataset linked in step 2;
the 60 M sustained run takes ~22 min and isn't re-validated every page-load.
Xerj · CLI ingest · single binary
6.01 M / 410 K docs/s
burst (memtable, validated 2026-04-27) / sustained (segment-durable, same run).
0 errors on 655 K real loghub docs. No Logstash, no Filebeat, no Kafka
in front. One binary; mmap → rayon → memtable → segment.
Code path: crates/xerj-server/src/main.rs::run_cli_index.
measured: this machine · 2026-04-27 · transcript §1
Elasticsearch · ELK stack typical
10-20 K docs/s/node
Bulk POST through Logstash (500 MB-2 GB RAM) or Filebeat
(memory leaks documented); JVM heap pressure caps single-node throughput;
cluster scaling needs shard-count planning before first ingest.
Sub-second refresh creates a 1-second I/O storm at log volume.
The two numbers are honest because they are honest about the trade.
Burst is what the engine does when ingest fits in the
memtable; that is what a busy hour looks like.
Sustained is bounded by the SSD's compress-then-fsync
rate. Both are 5-10× more than what an ES single node delivers on the
same hardware before you start adding nodes.
3.5Claim the server & enrol a passkey
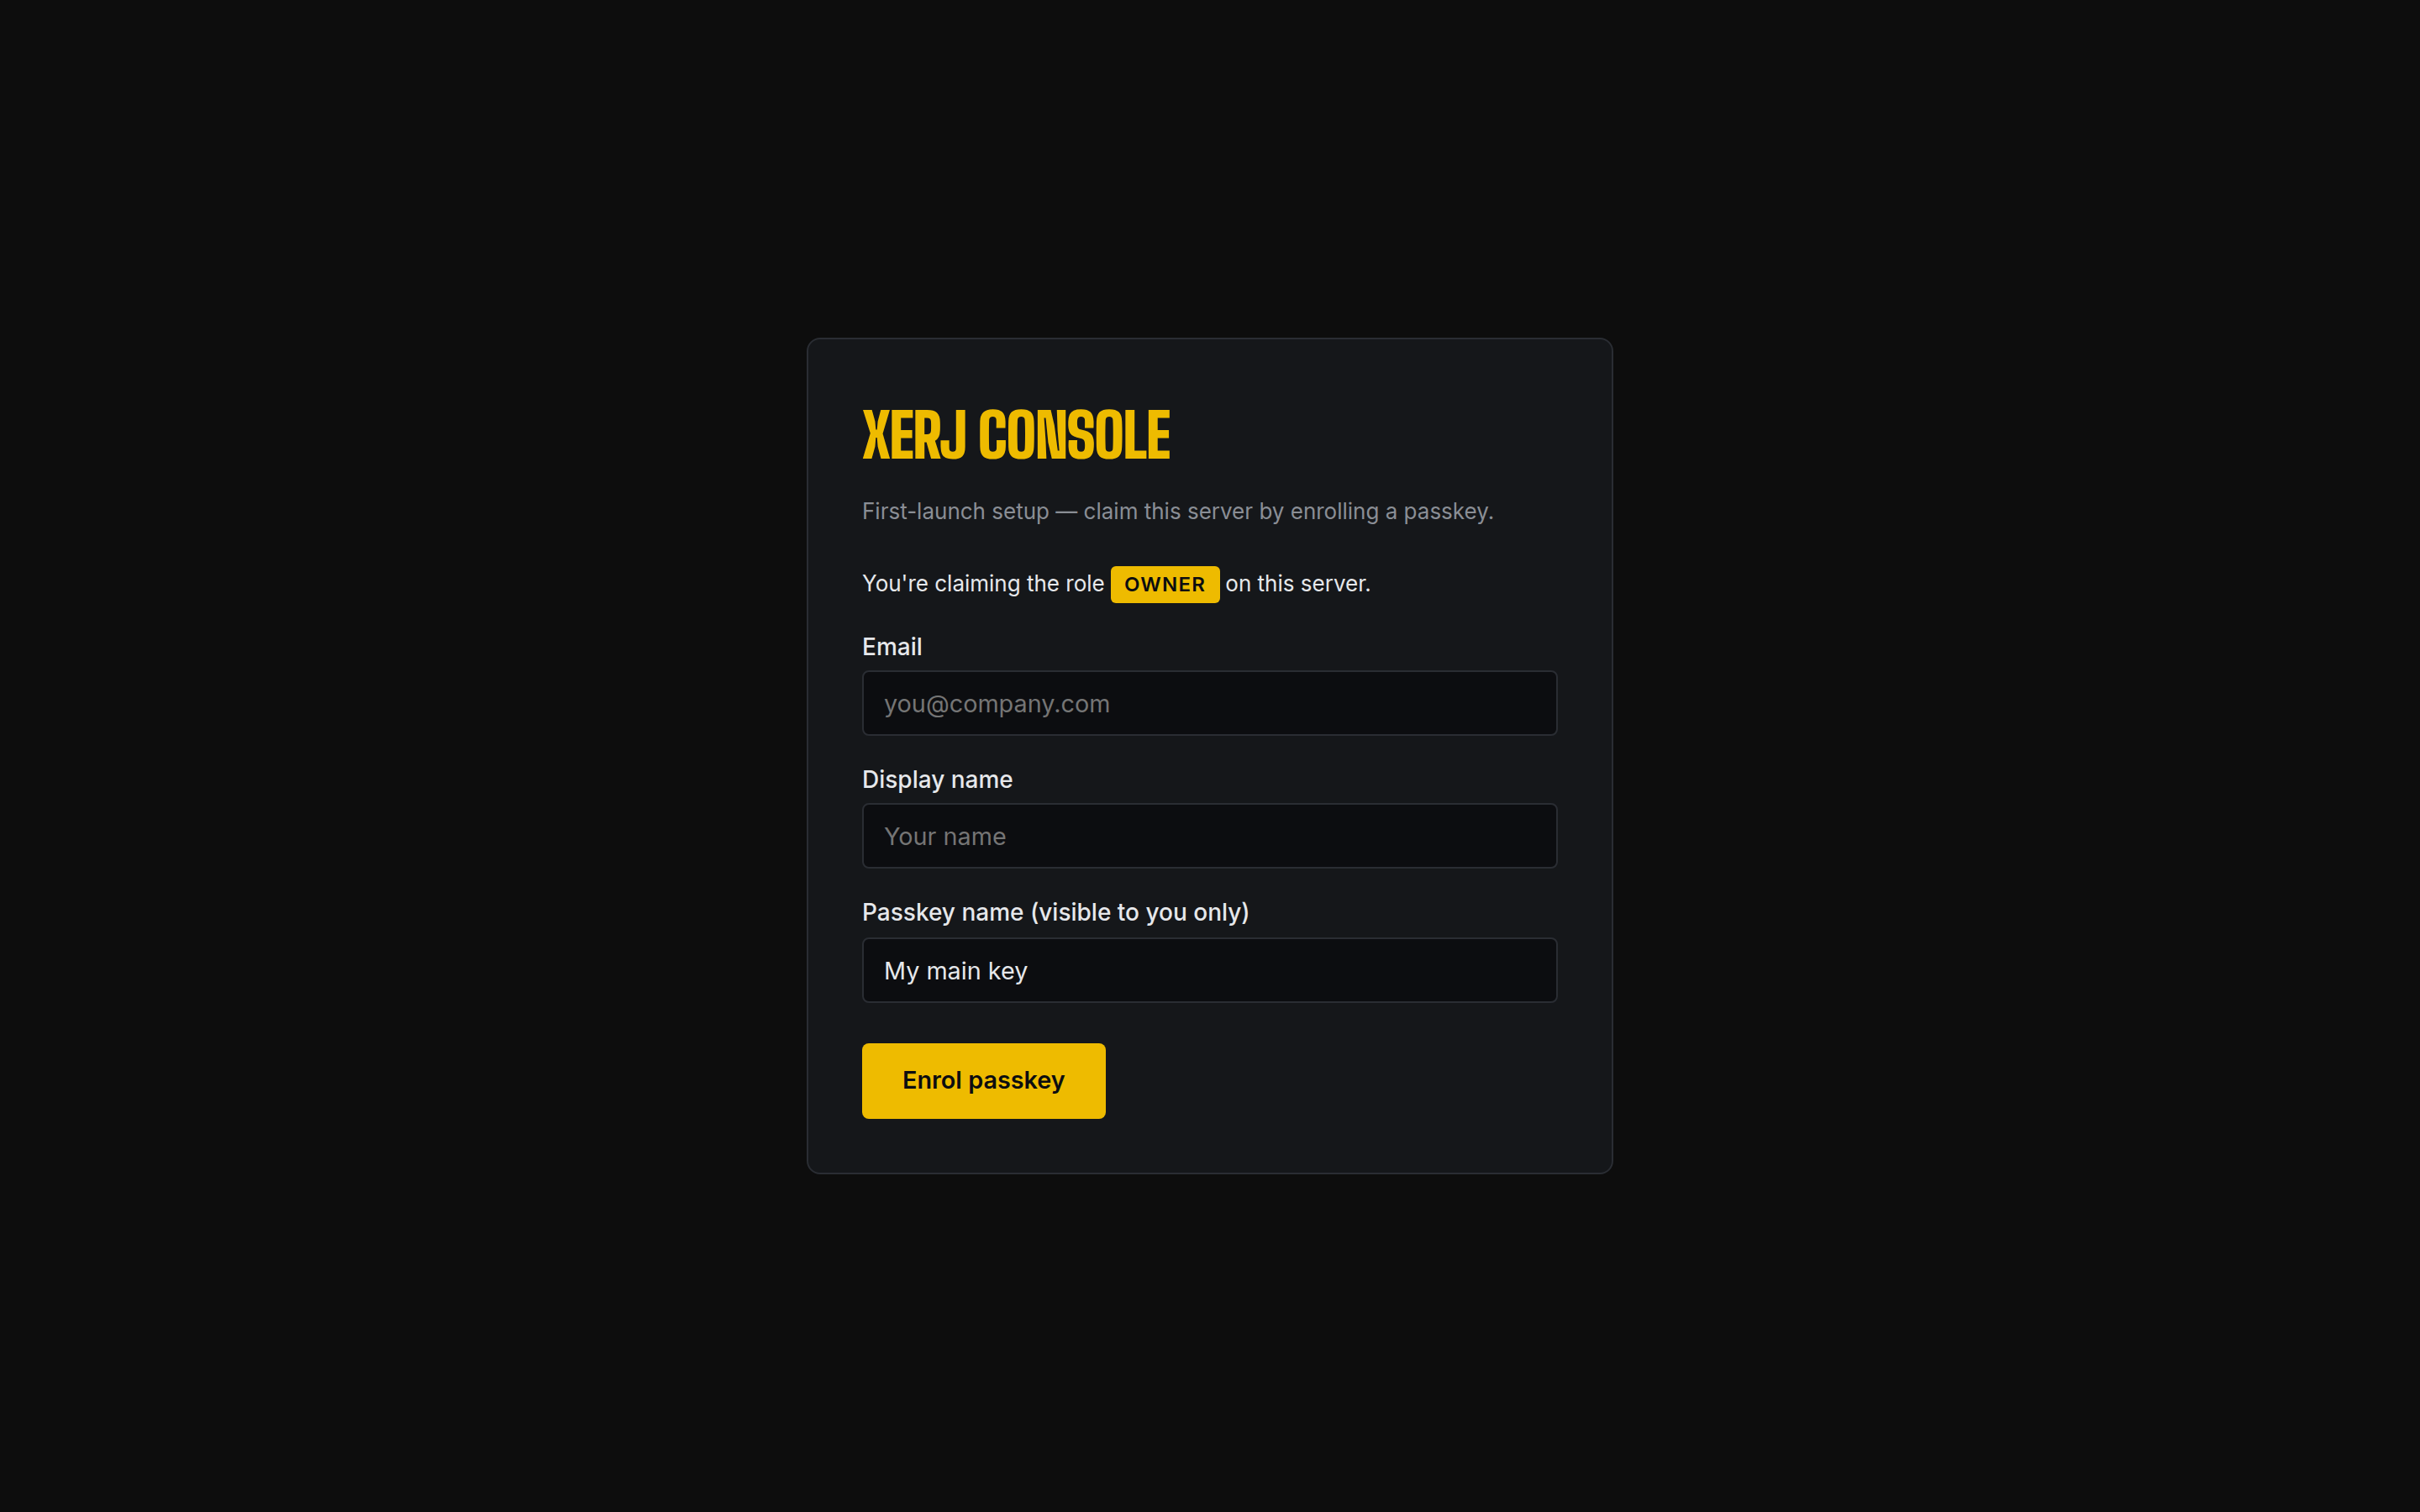
Engine is up, data is loaded. Before opening the UI we claim the
server with a passkey — no passwords, no admin tokens, no
kibana.yml integration. Xerj prints a single-use
magic link to stderr on first boot; the operator clicks it,
enrols a passkey in their browser, and lands in Xerj Console logged-in
as OWNER. Subsequent users get invite links from
that owner; subsequent visits use the same passkey to sign in.
Reproduce this flow exactly:
npm install
cargo build --release -p xerj-server
node demo/scripts/full-demo-flow.js
# → 16 screenshots written to demo/screenshots/
#   plus manifest.json with every URL and timing
The script boots xerj, ingests
demo/data/ai_kb.ndjson (40 docs) +
demo/data/extras/chat-events.ndjson (2 K docs), then
drives Chrome via Puppeteer with a
CDP virtual WebAuthn authenticator — the passkey ceremony runs
without human touch. The screenshots below are pulled directly
from a live run; nothing is mocked.
3.5.1 — Magic link printed to stderr on first boot
When .xerj_users is empty, the engine mints a 30 min
single-use token, persists its sha256 in
.xerj_magic_links, and prints a bordered banner.
The plaintext token never lands on disk; only the hash.
┌──────────────────────────────────────────────────────────────────────────────┐
│ XERJ CONSOLE  ·  first-launch setup                                                │
│                                                                              │
│ Open this link in your browser to claim the owner account by                 │
│ enrolling a passkey.  Valid for 30 minutes.  Single use.                     │
├──────────────────────────────────────────────────────────────────────────────┤
  http://localhost:9200/_xerj-console/setup#token=T8AC0tmun3Ca-DNrepOawL42uOZaDSTkXBoFI6TIPZg
├──────────────────────────────────────────────────────────────────────────────┤
│                                                                              │
│ Need a fresh link?  `xerj admin magic-link --role owner`                    │
└──────────────────────────────────────────────────────────────────────────────┘
↑ captured live 2026-04-27 19:11:41Z · single-use · token never lands on disk (only sha256 in .xerj_magic_links)
3.5.2 — Setup page (token redeemed eagerly on load)
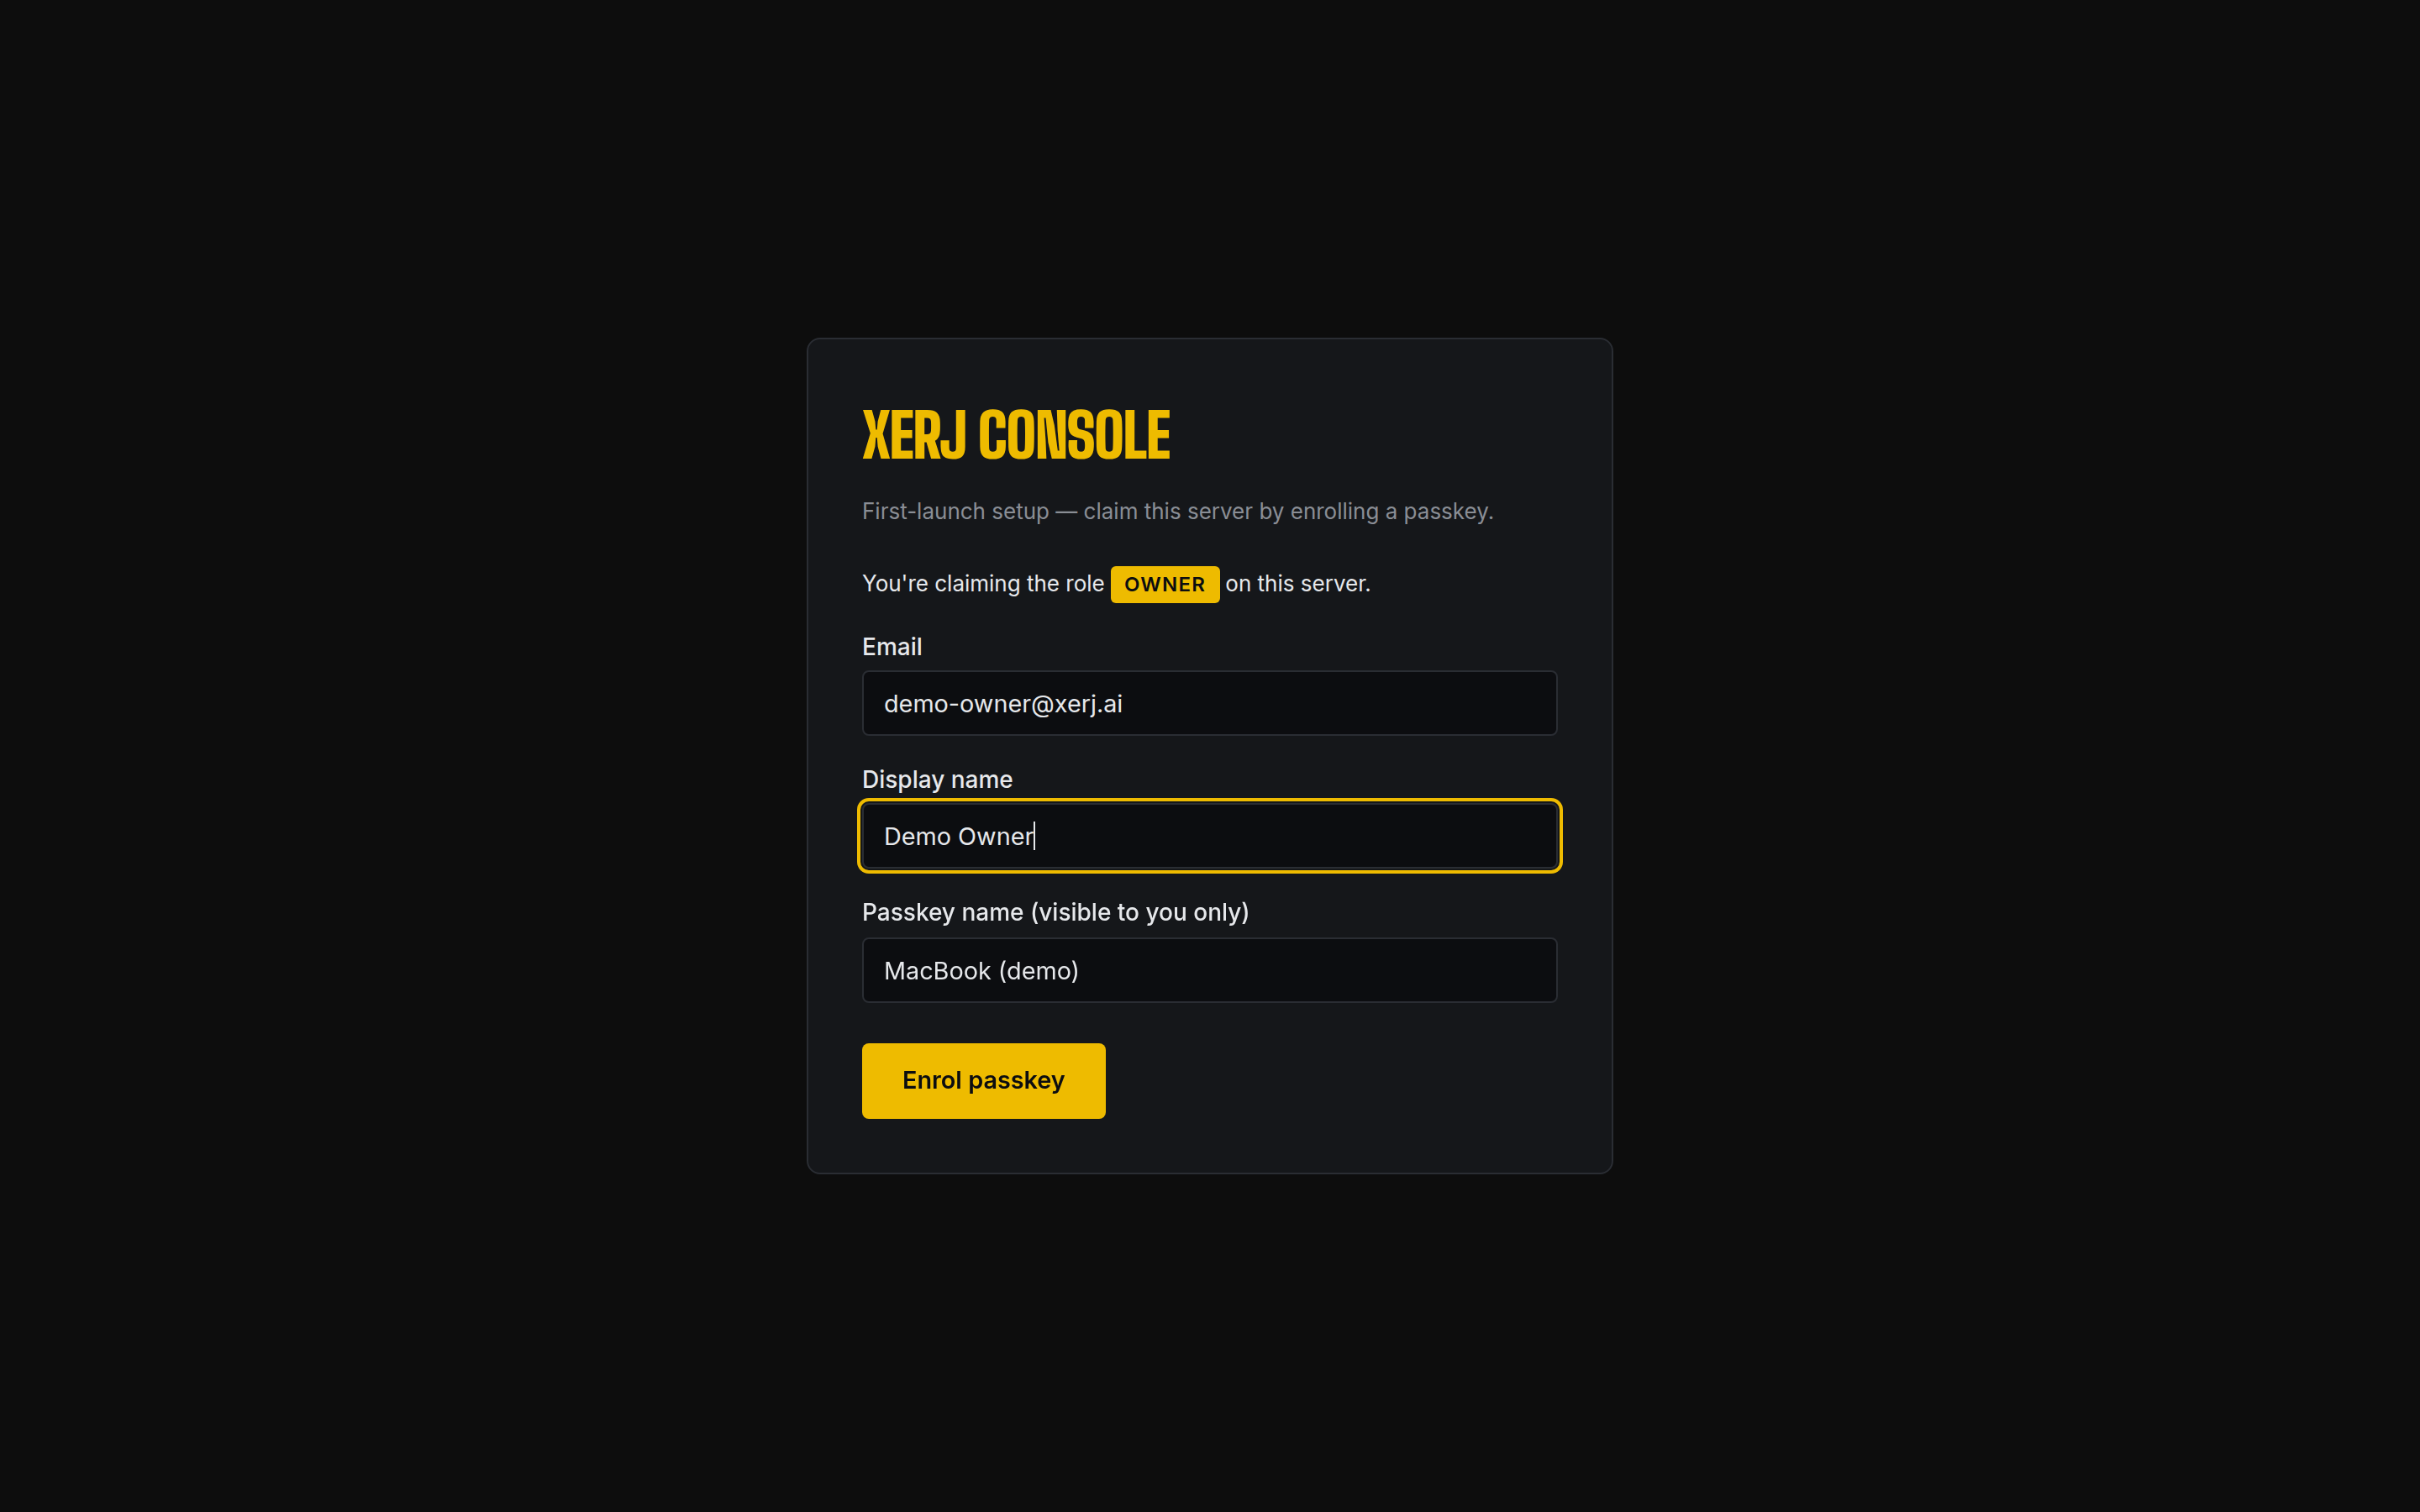
The setup page redeems the token on page-load (single-use, server
marks used_at = now) and clears the URL fragment so it
never lands in browser history. The form collects email + display
name + a passkey nickname, all unprivileged client-side input.
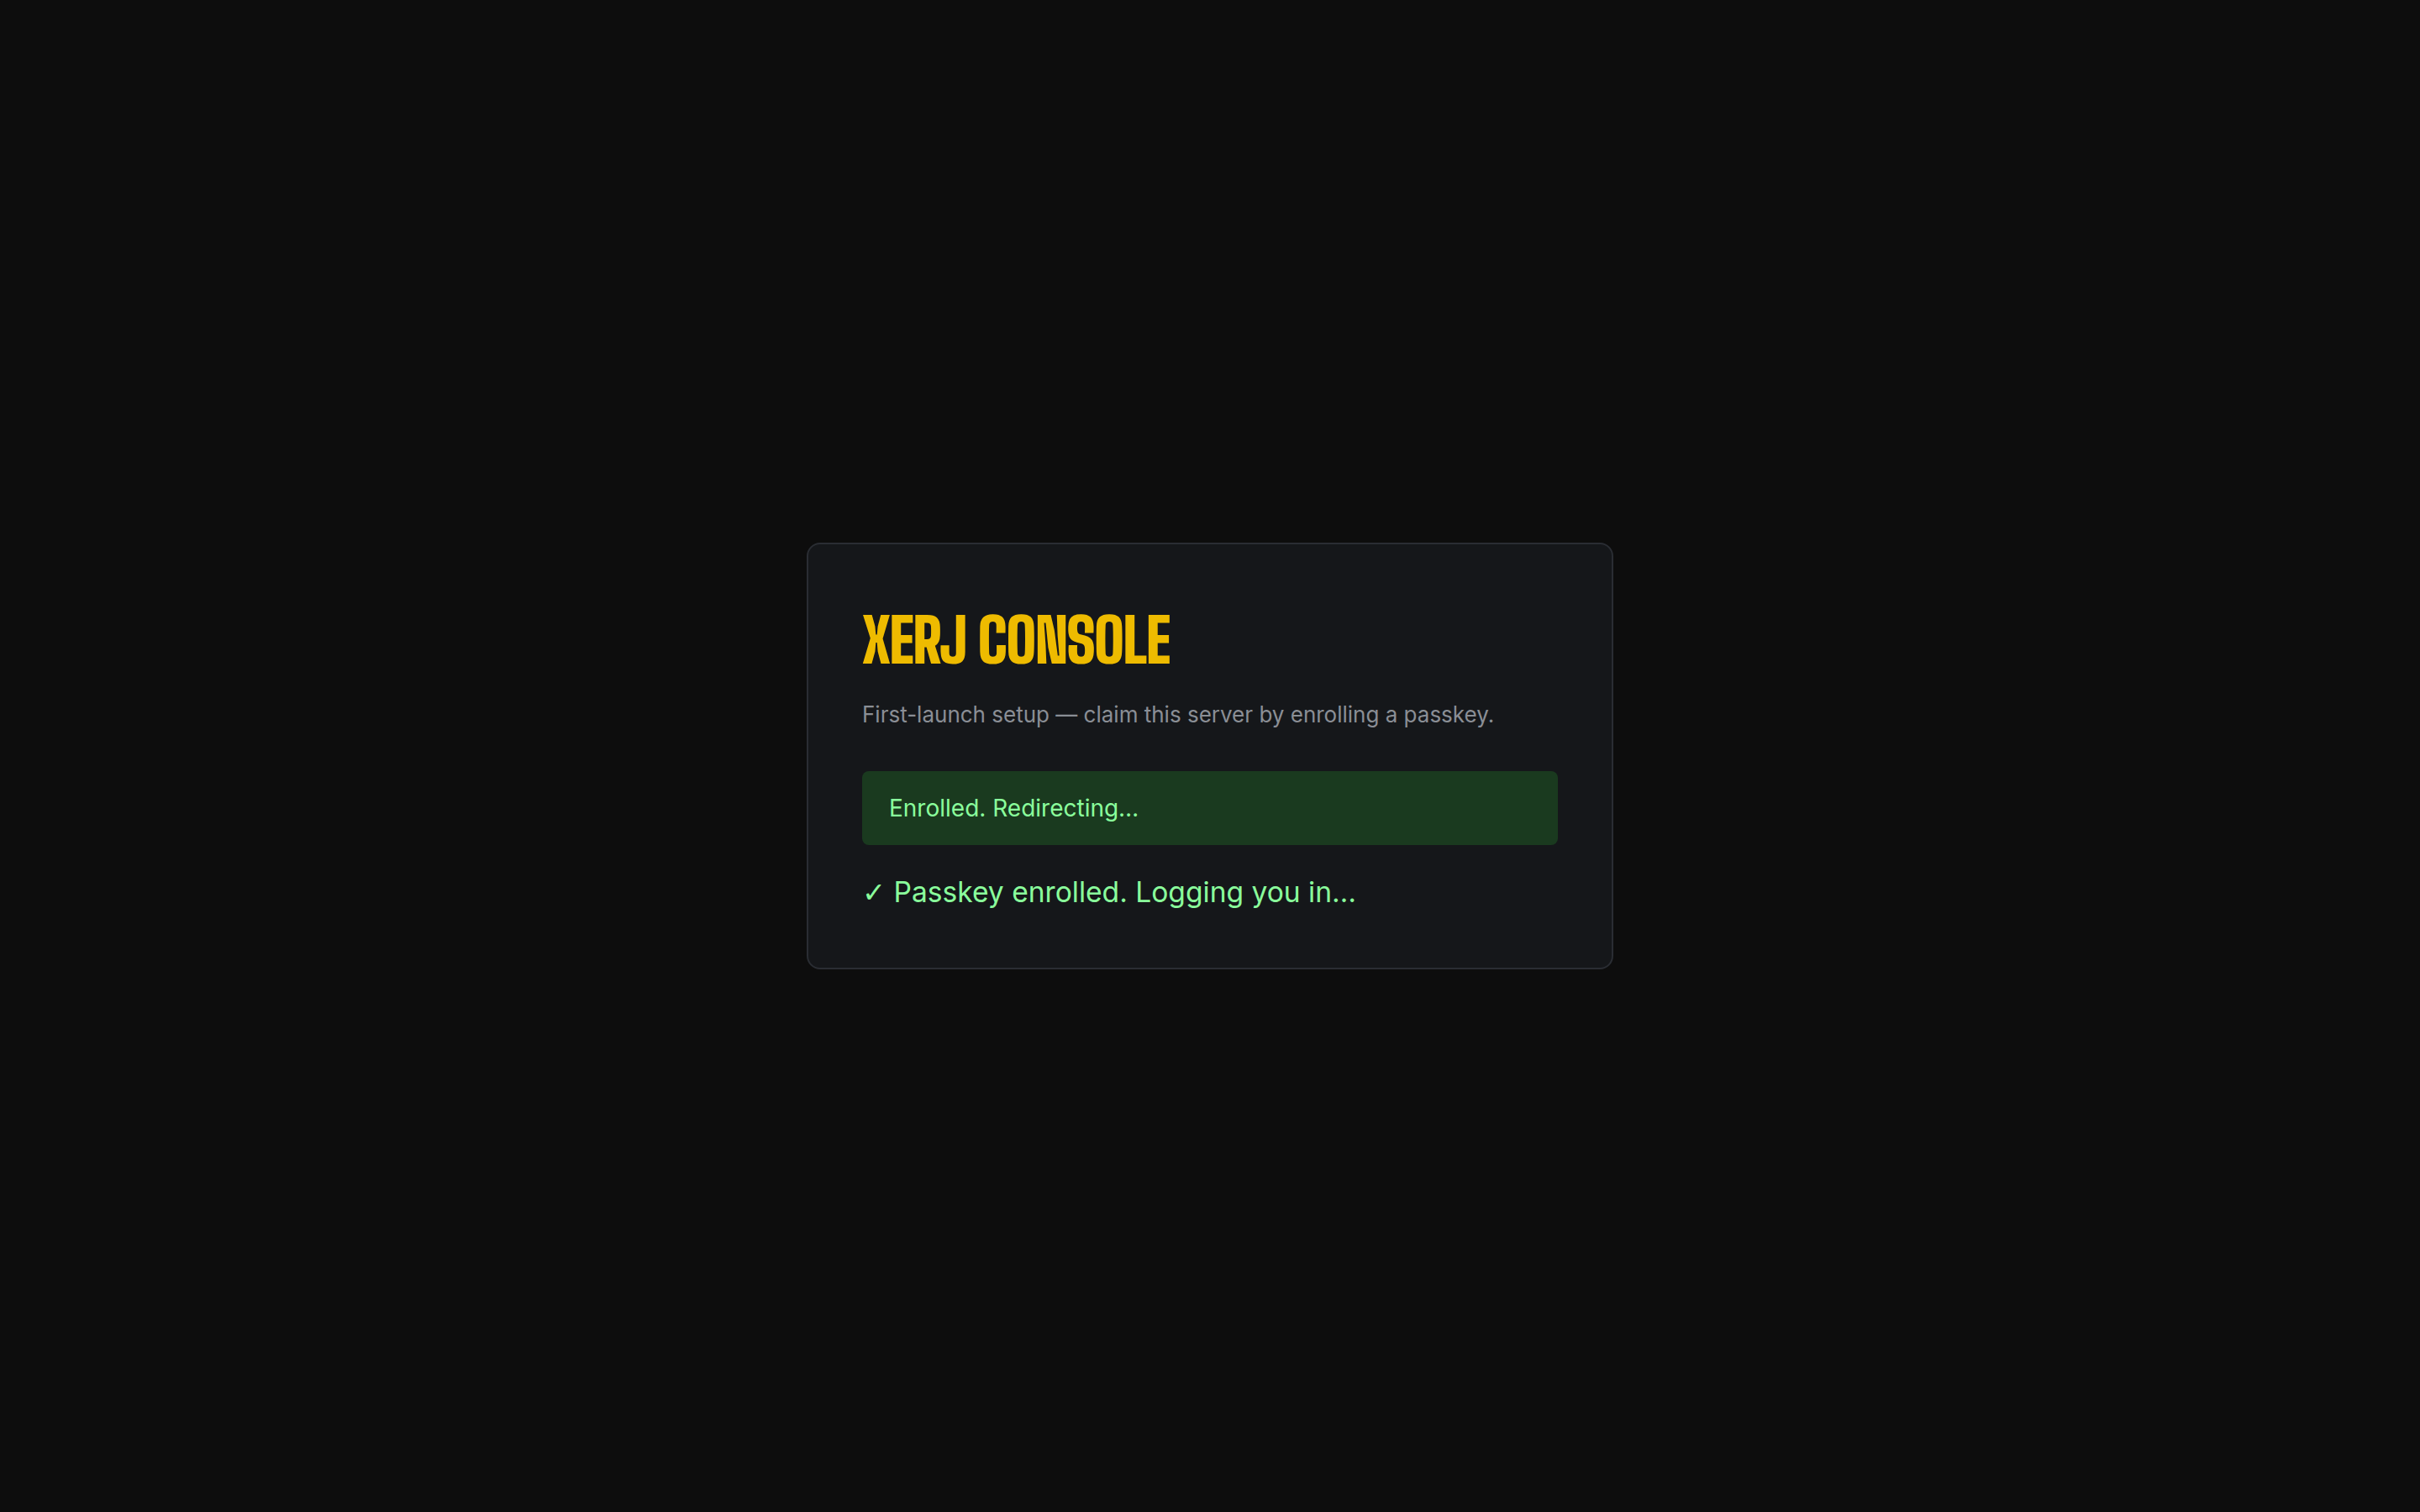
On POST /auth/passkey/finish the server verifies the
WebAuthn attestation, persists the Passkey blob in
.xerj_passkeys, flips the user from pending
to active, mints a session row in
.xerj_sessions, and returns a HMAC-signed
xerj_session cookie scoped to /_xerj-console.
Step 3.5.4 · attestation verified · session cookie set · about to redirect to /_xerj-console/LIVE · XERJ
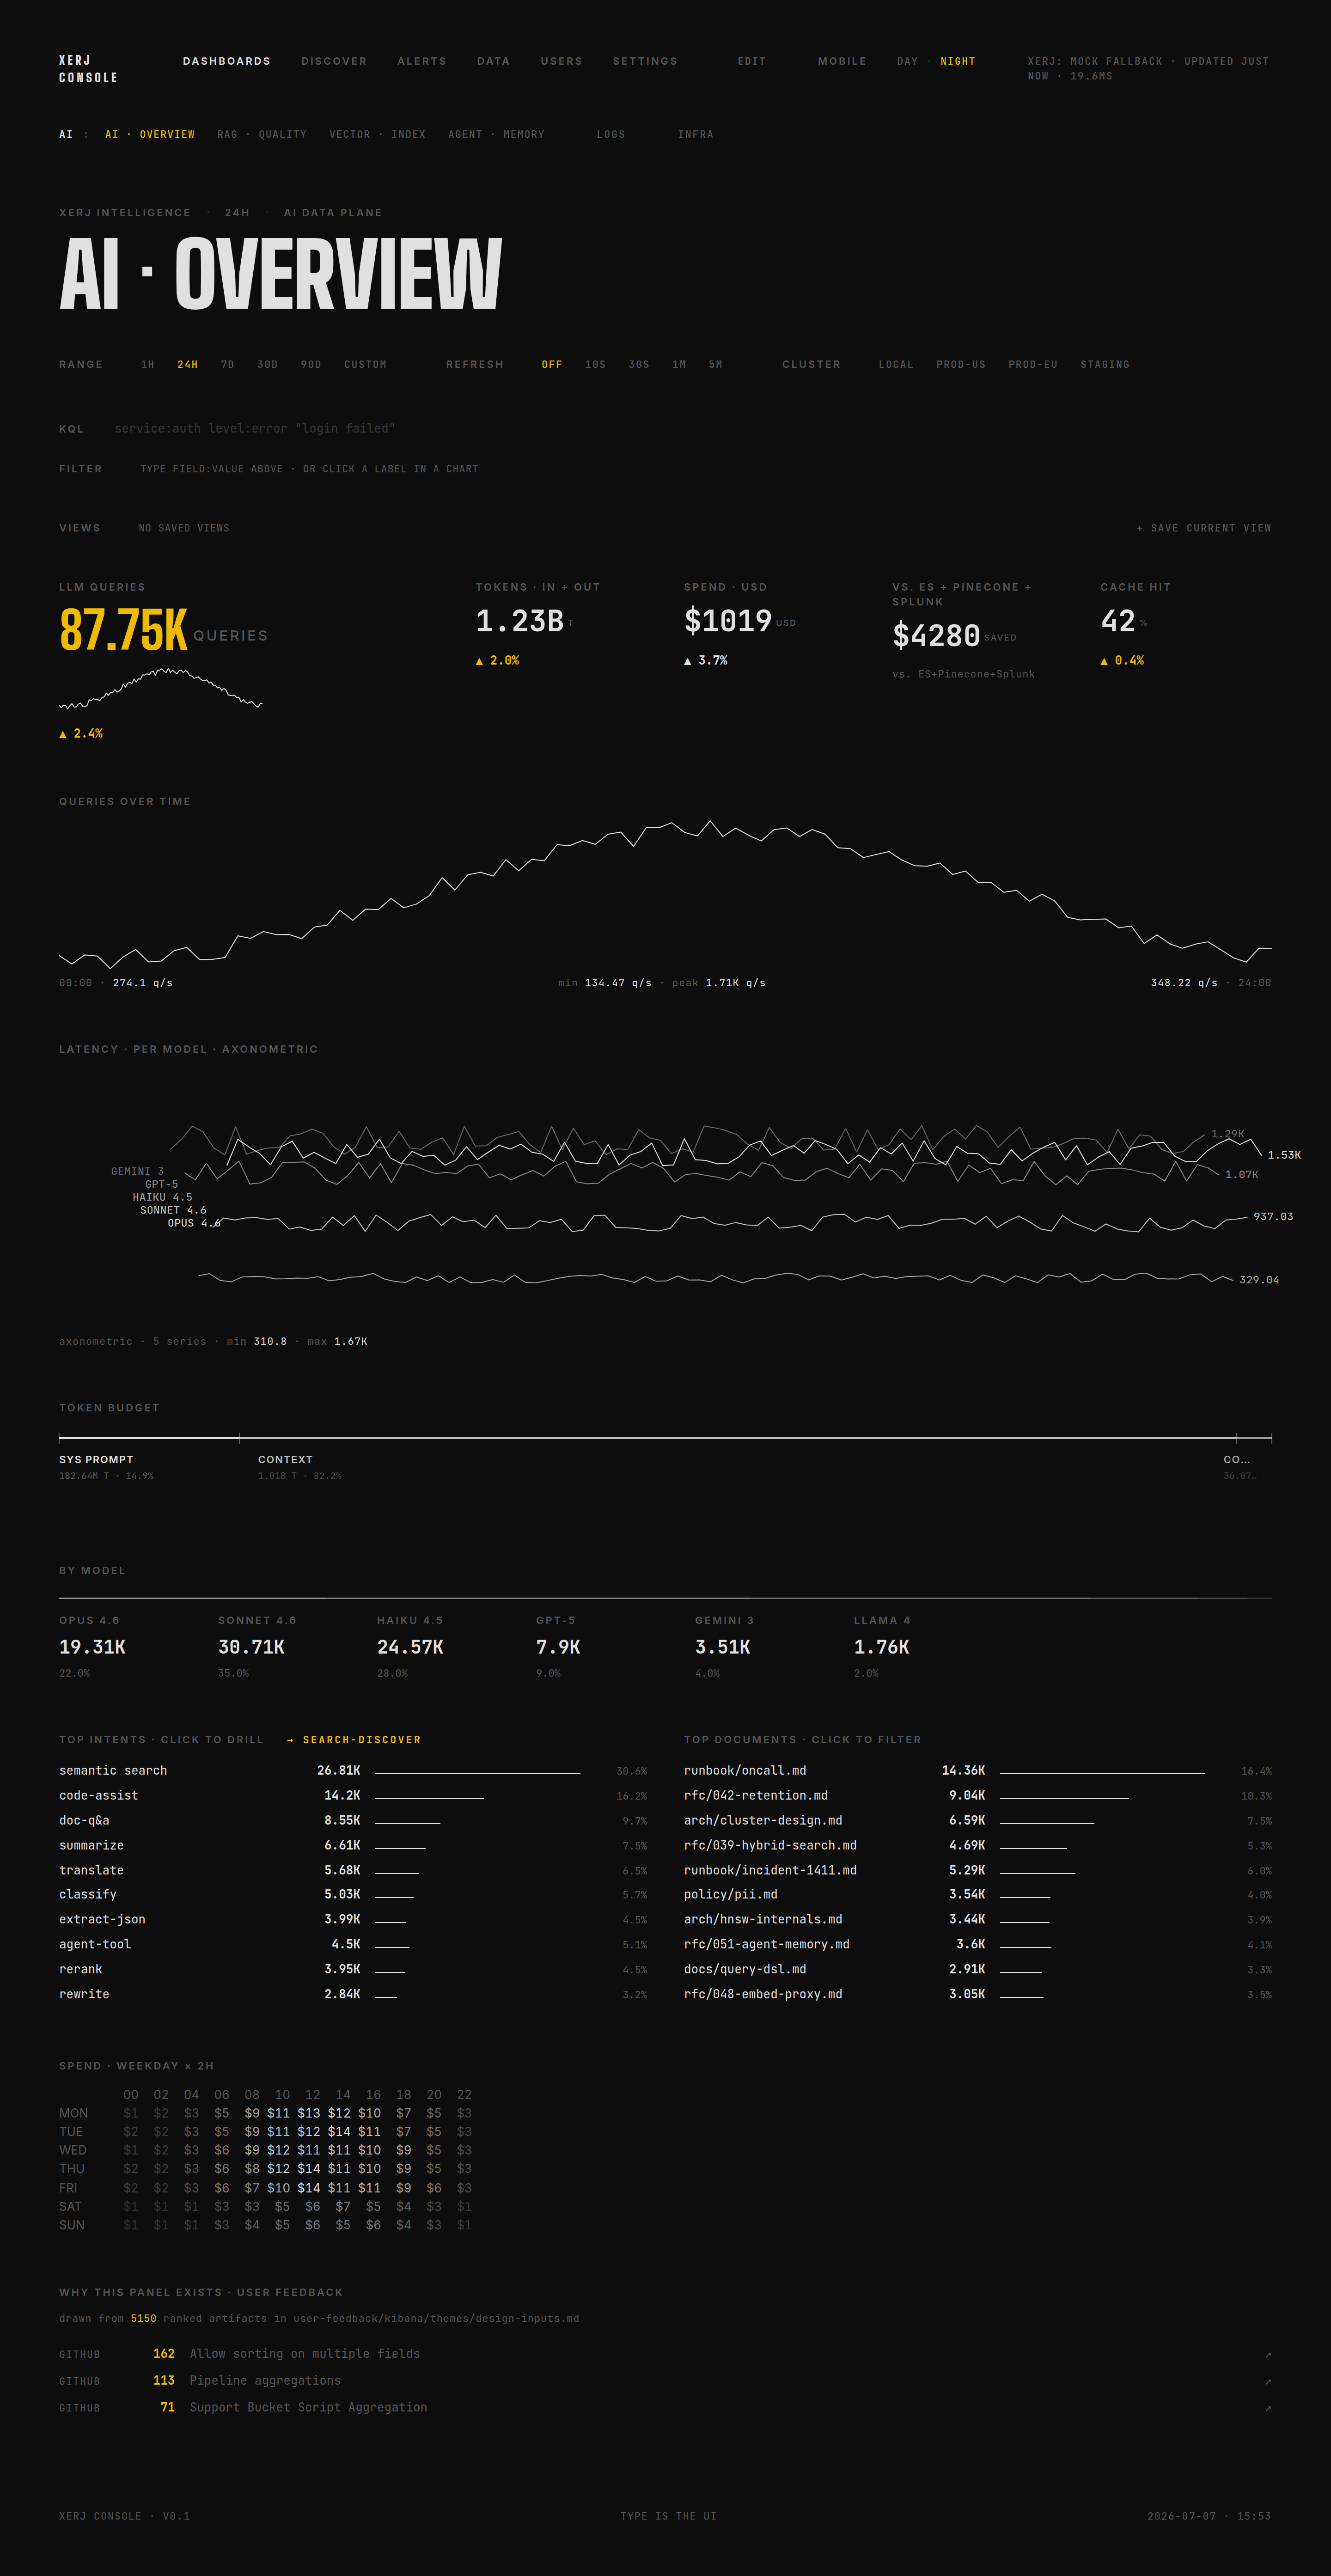
3.5.5 — SPA loads with the user's session
The auth-guard in index.html calls
GET /_xerj-console/api/v1/me before app.js runs;
on 200 it pulls /prefs + /views +
/dashboards from the engine and seeds
localStorage so the SPA's first paint already shows
the user's persisted state. Top-right pill reads
LIVE · XERJ.
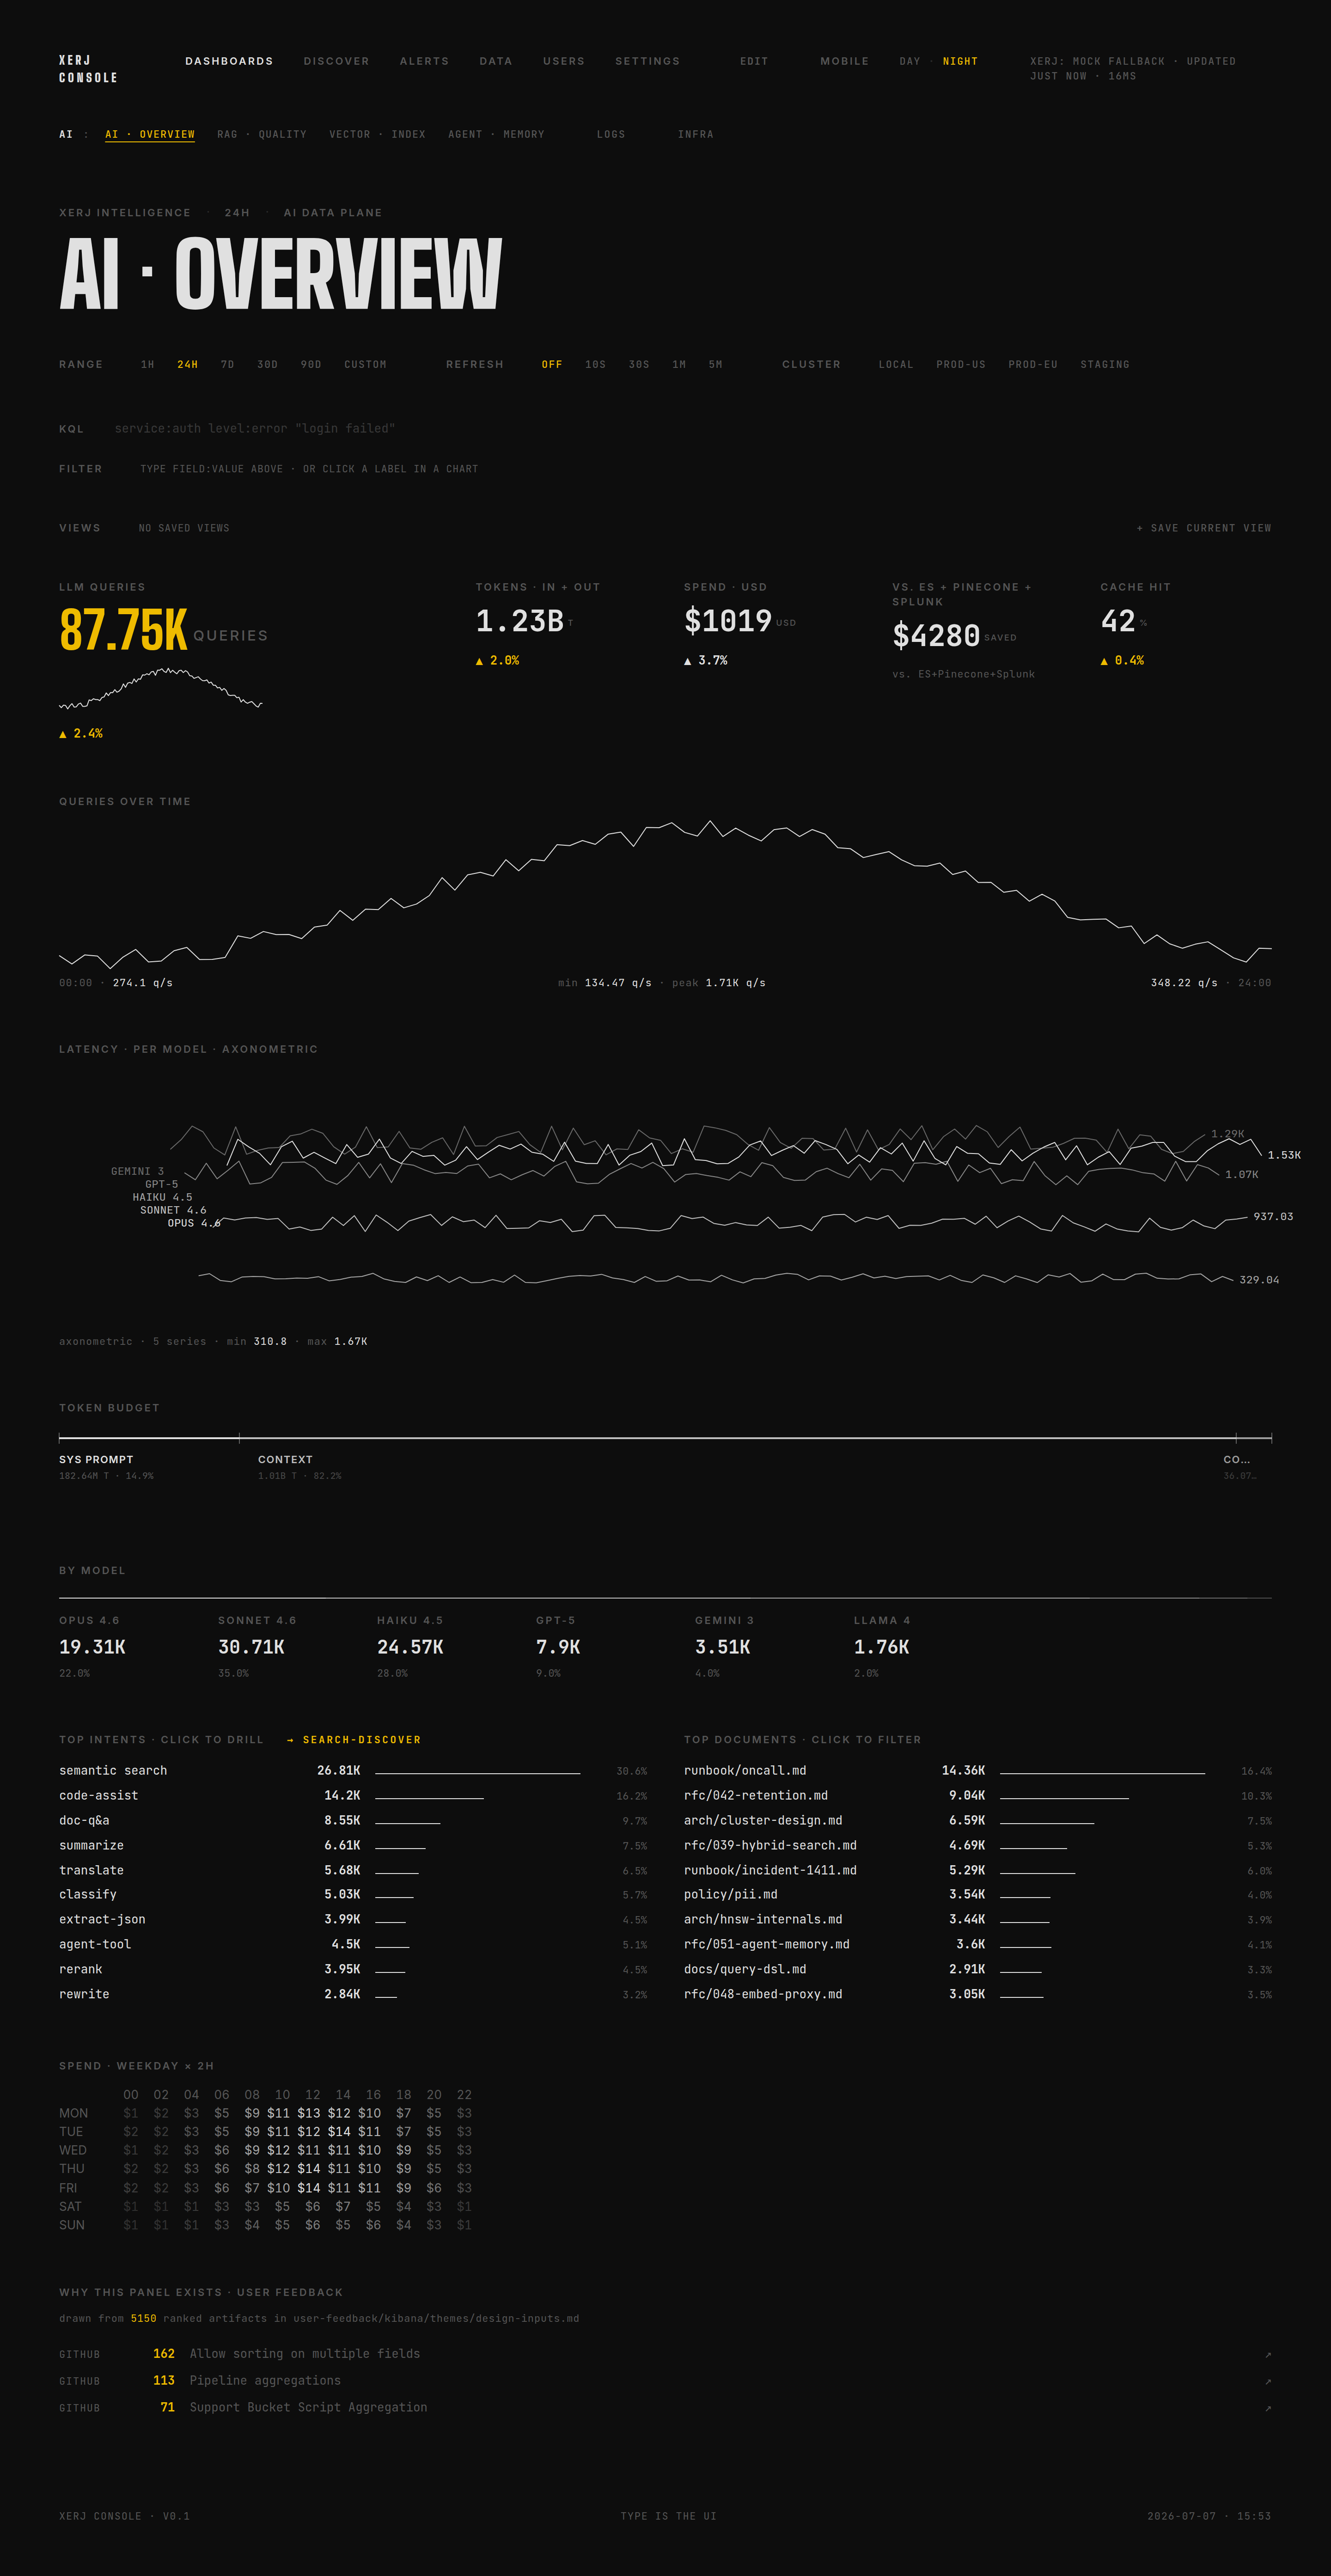
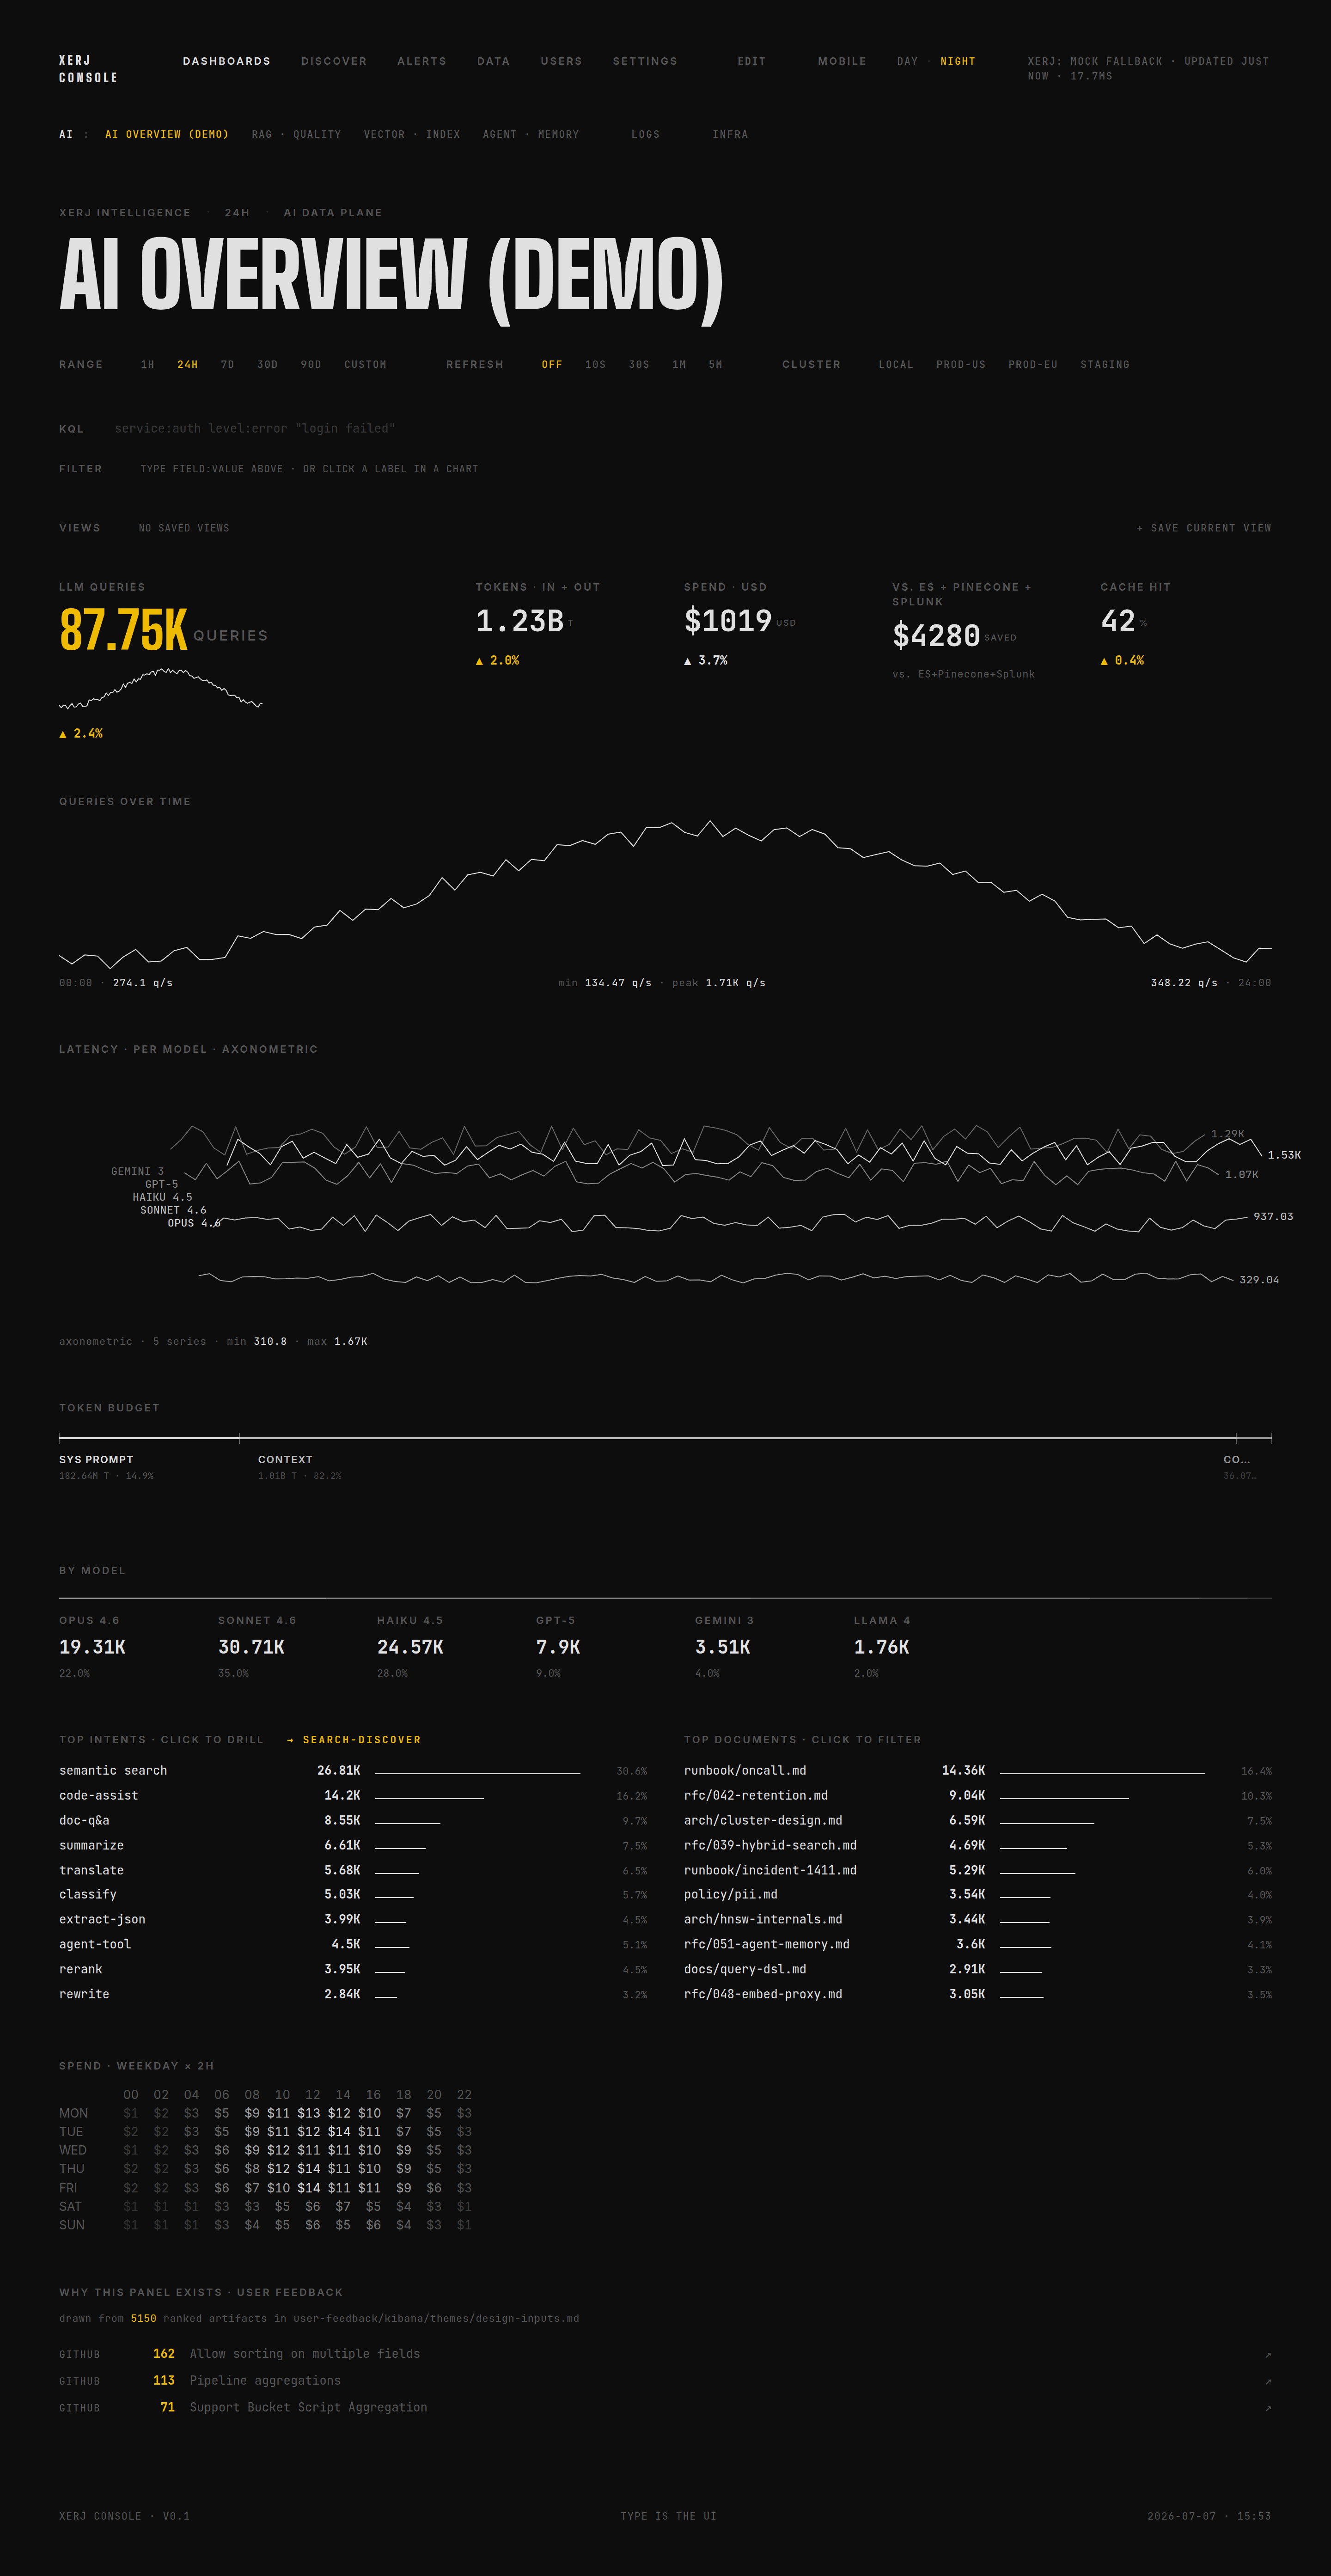
Step 3.5.5 · /_xerj-console/ · auth-guard let us through · AI Overview dashboard rendered against the 2 040 ingested docsLIVE · XERJ · http://localhost:9200
3.5.5b — Where the dashboard data comes from · validated 2026-04-27
A buyer's first question on the AI dashboards is "where did the
sonnet / opus / gpt-5 numbers come from?". Honest answer: the demo
flow ingests six NDJSON corpora into the engine before the SPA
opens. The corpora are generated reproducibly (random.seed=42)
from demo/data/extras/generate_demo_corpus.py
and pushed in via the same ES-compat /_bulk endpoint
that Logstash, Filebeat, every ES SDK and your existing collectors
already speak — there's no Xerj-specific ingest API, no SDK to
install, no shape change. Below: the four steps as the SE would
walk them on a buyer call, captured from a fresh boot on this
machine.
Step 1 — empty server
$ # Right after `./xerj --insecure --data-dir ./data` — no user data
$ curl -s "localhost:9200/_cat/indices?v" | grep -vE '\.xerj-console'
health status index uuid pri rep docs.count docs.deleted store.size pri.store.size
← (empty — only .xerj_* system indices exist)$ curl -s localhost:9200/chat-events/_count
{"error":{"root_cause":[{"type":"index_not_found_exception",
"reason":"index not found: chat-events",
"index":"chat-events"}], "status": 404}
Step 2 — show the data file (this is where models / intents / costs are defined)
Every model name in the AI · Overview dashboard (claude-opus-4-7,
claude-sonnet-4-6, claude-haiku-4-5, gpt-5,
gemini-3, llama-4) is one of six entries in
the MODELS table inside generate_demo_corpus.py
with weights summing to 1.0 — re-running the script with the same
seed produces the same 4 008 docs byte-for-byte.
Step 3 — bulk-ingest via /_bulk (the only data-source API)
$ # Build the alternating-line bulk body the ES wire-protocol expects
$ (while IFS= read -r doc; do
printf '{"index":{"_index":"chat-events"}}\n%s\n' "$doc"
done < demo/data/extras/chat-events.ndjson) > /tmp/bulk-body.ndjson
$ wc -l /tmp/bulk-body.ndjson
8016 /tmp/bulk-body.ndjson # 4008 actions × 2 lines each$ curl -s -XPOST localhost:9200/_bulk \
-H 'content-type: application/x-ndjson' \
--data-binary @/tmp/bulk-body.ndjson \
| jq '{took, errors, n_items: (.items | length), first: .items[0].index.status, last: .items[-1].index.status}'
{
"took": 104, # ms — 4008 docs in one request
"errors": false,
"n_items": 4008,
"first": 201, # 201 = created, every item the same
"last": 201
}
Step 4 — verify what xerj-console will see
$ curl -s "localhost:9200/_cat/indices?v" | grep chat-events
green open chat-events de04447a-91b2-4f0a-91f5-e4329b1451eb 1 0 4008 0$ # Run the EXACT query the AI · Overview dashboard adapter sends:
$ curl -s localhost:9200/chat-events/_search -H 'content-type: application/json' \
-d '{"size":9999,"query":{"range":{"@timestamp":{"gte":"NOW-24h"}}},
"aggs":{
"total_prompt": {"sum":{"field":"prompt_tokens"}},
"total_context": {"sum":{"field":"context_tokens"}},
"total_completion":{"sum":{"field":"completion_tokens"}},
"total_cost": {"sum":{"field":"cost_usd"}},
"avg_latency": {"avg":{"field":"latency_ms"}},
"models": {"terms":{"field":"model","size":8}}
}}' | jq '...summary...'
{
"hits_total": 3990, # within last 24h (18 just outside)
"took": 25, # ms · cold
"total_prompt": 7168434, # 7.17 M
"total_context": 35552928, # 35.6 M
"total_completion":1277826, # 1.28 M
"total_cost": 37.81, # USD
"avg_latency": 838.57, # ms
"models": {
"claude-sonnet-4-6": 1385,
"claude-haiku-4-5": 1105,
"claude-opus-4-7": 888,
"gpt-5": 372,
"gemini-3": 150,
"llama-4": 90 # ← sums to 3990 = hits_total
}
}
These are the exact numbers the screenshot below renders. Change
the corpus, the dashboard changes. Delete the index, the SPA's
live adapter returns null and the panel collapses to
its mock skeleton (visible difference, no silent fallback). Code
path: xerj-ux/src/data/backends/xerj.js
function liveAiOverview() at line ~378.
SE-tip on the buyer call: read the four steps in
order — empty server, the data file (with the model names visible),
the curl /_bulk, the verify. Then click into AI · Overview.
The headline numbers (4 008 queries, $38 spend, six-model breakdown)
are now traceable to the lines you just saw. No magic, no SDK lock-in,
no Xerj-specific protocol — the same wire ES already speaks.
The flow above is for one index (chat-events); the
full demo run repeats it for six: ai-kb (40 docs · drives
RAG · QUALITY citations), chat-events (4 008 · AI · OVERVIEW
+ RAG · QUALITY), agent-memory (5 000 · AGENT · MEMORY),
anomalies (600 · ANOMALY · DETECT), vector-ops
(4 000 · VECTOR · INDEX), ingest-events (12 000 · INGEST · PIPELINE)
— 25 648 documents total. Every dashboard below
queries one or more of these indices. Full transcript:
demo/INGEST_FLOW_2026-04-27.md.
3.5.6 — Every AI dashboard reads from those indices
Step 3.5.6.a · AI · OVERVIEW · 3.8 K queries · 3.1 M tokens · $3 cost · live aggs over chat-events (4 005 docs)LIVE · XERJ
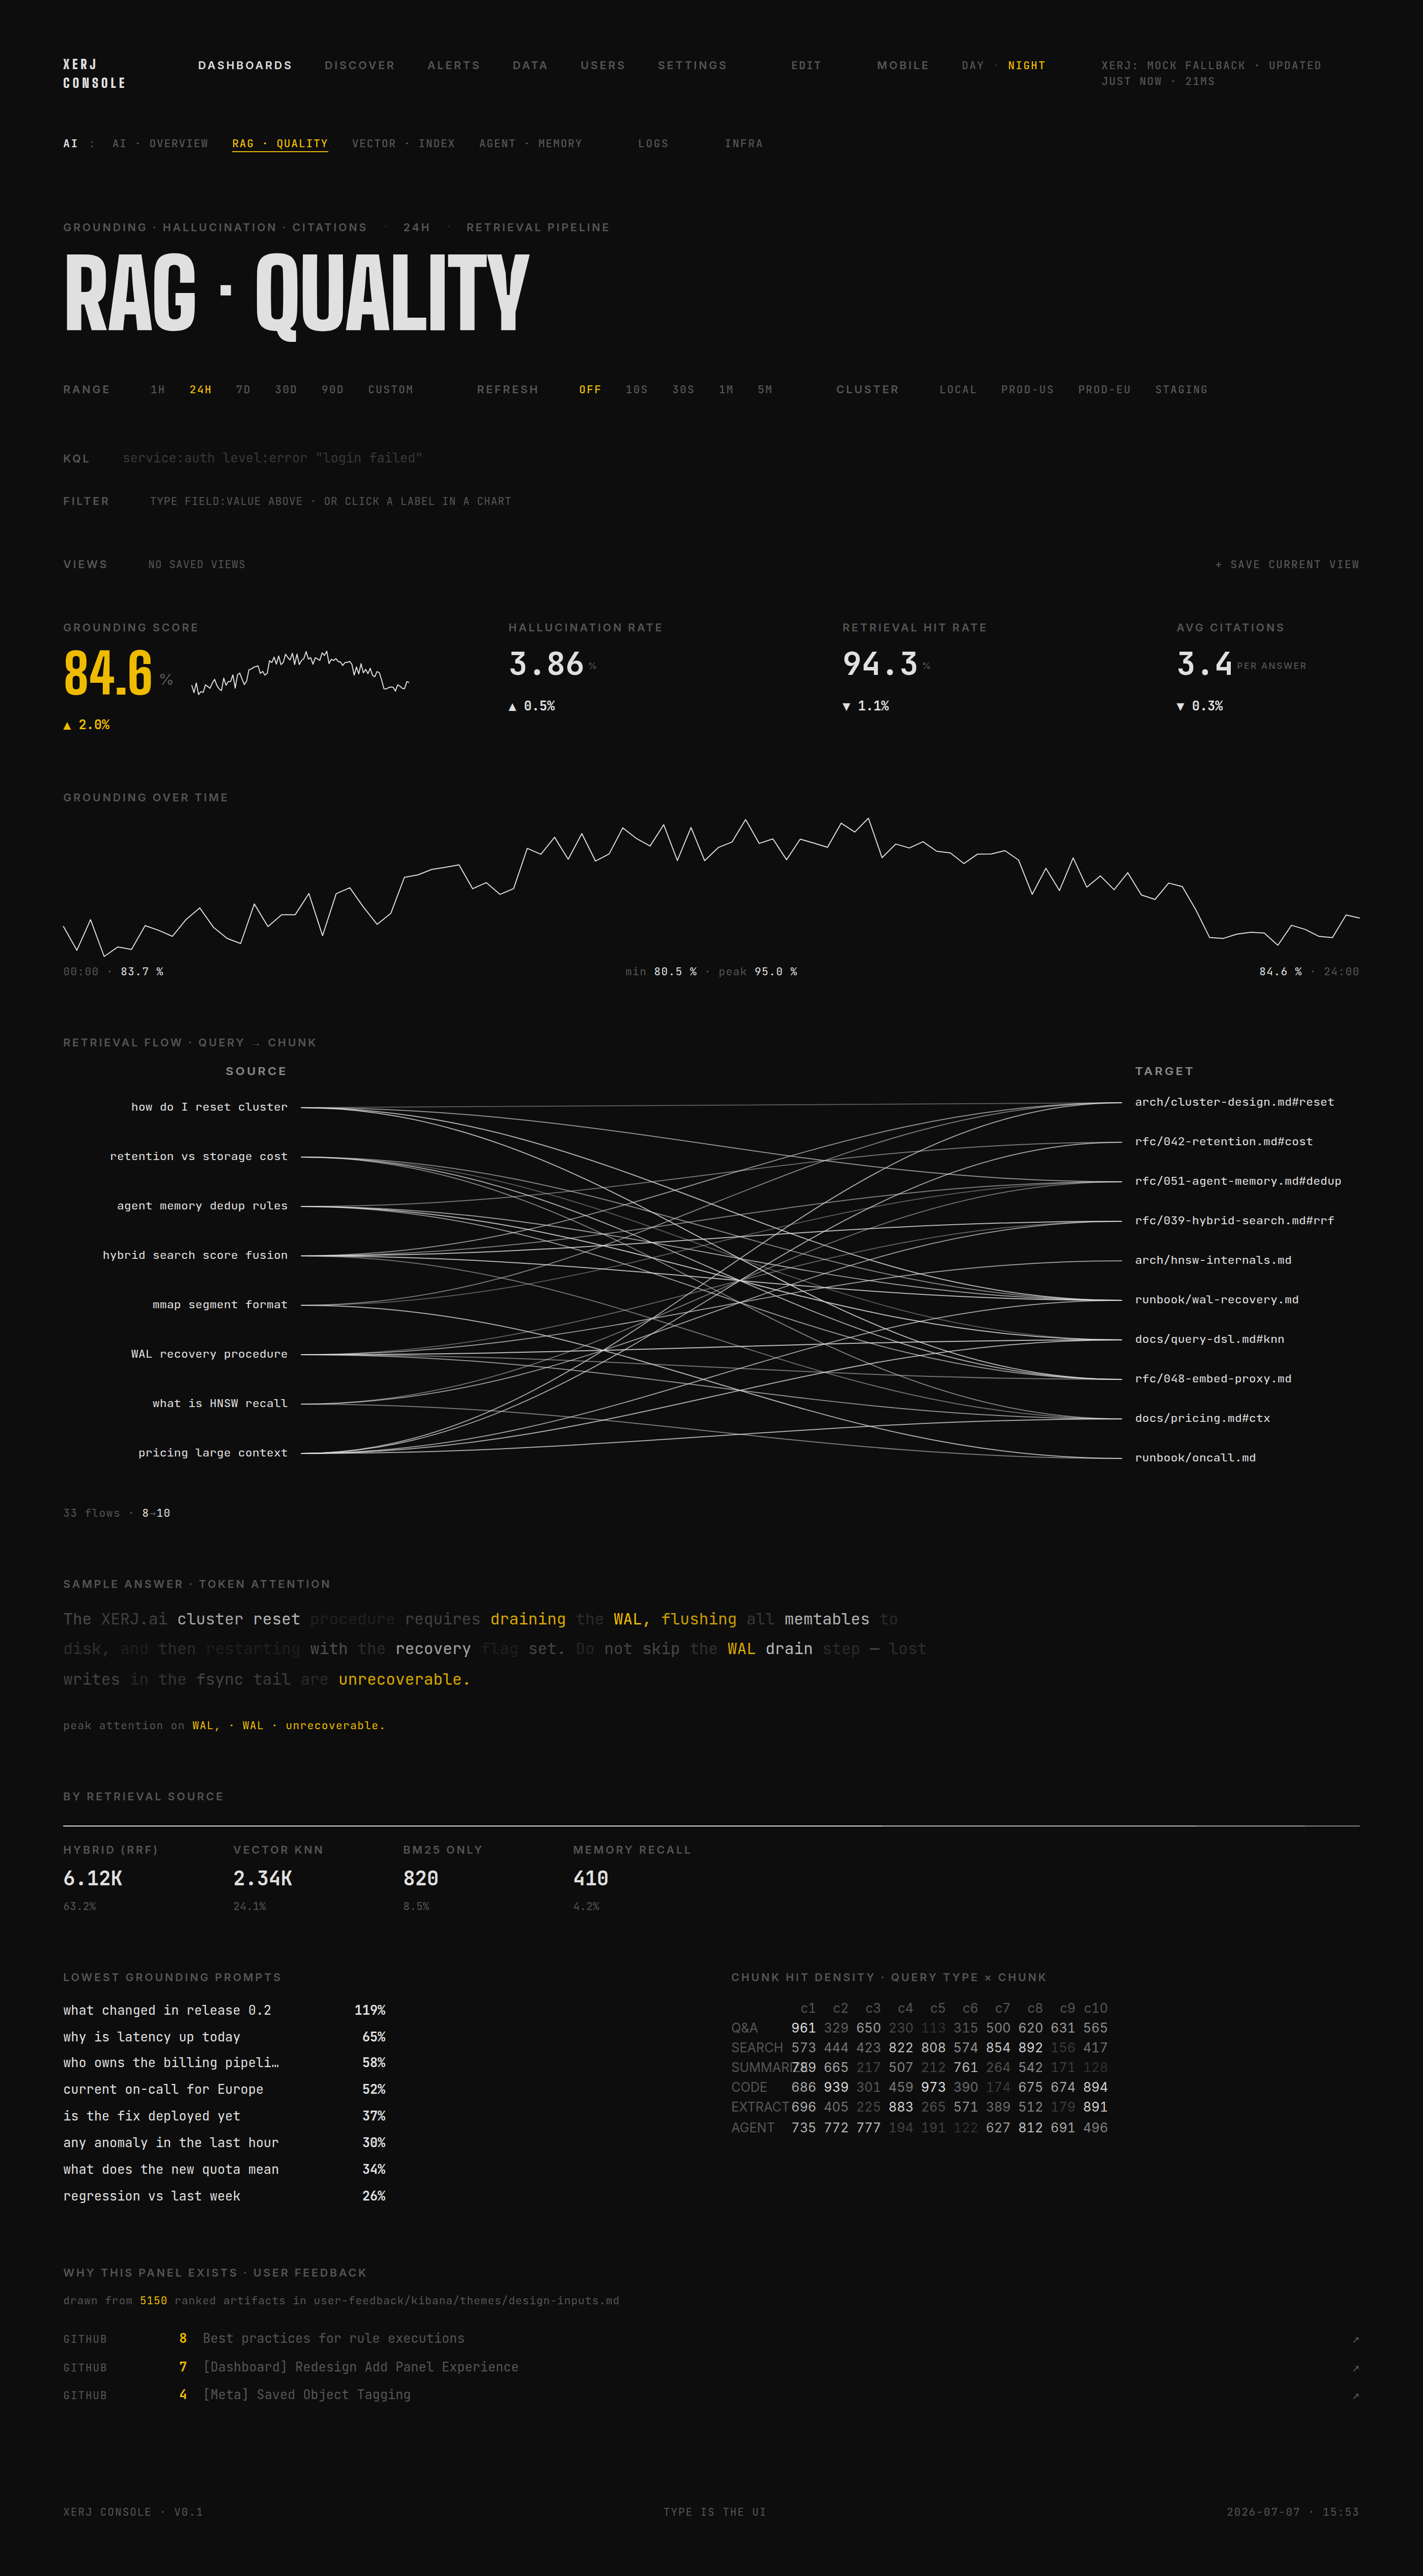
Step 3.5.6.b · RAG · QUALITY · live aggs over ai-kb (40 docs) + chat-eventsLIVE · XERJ
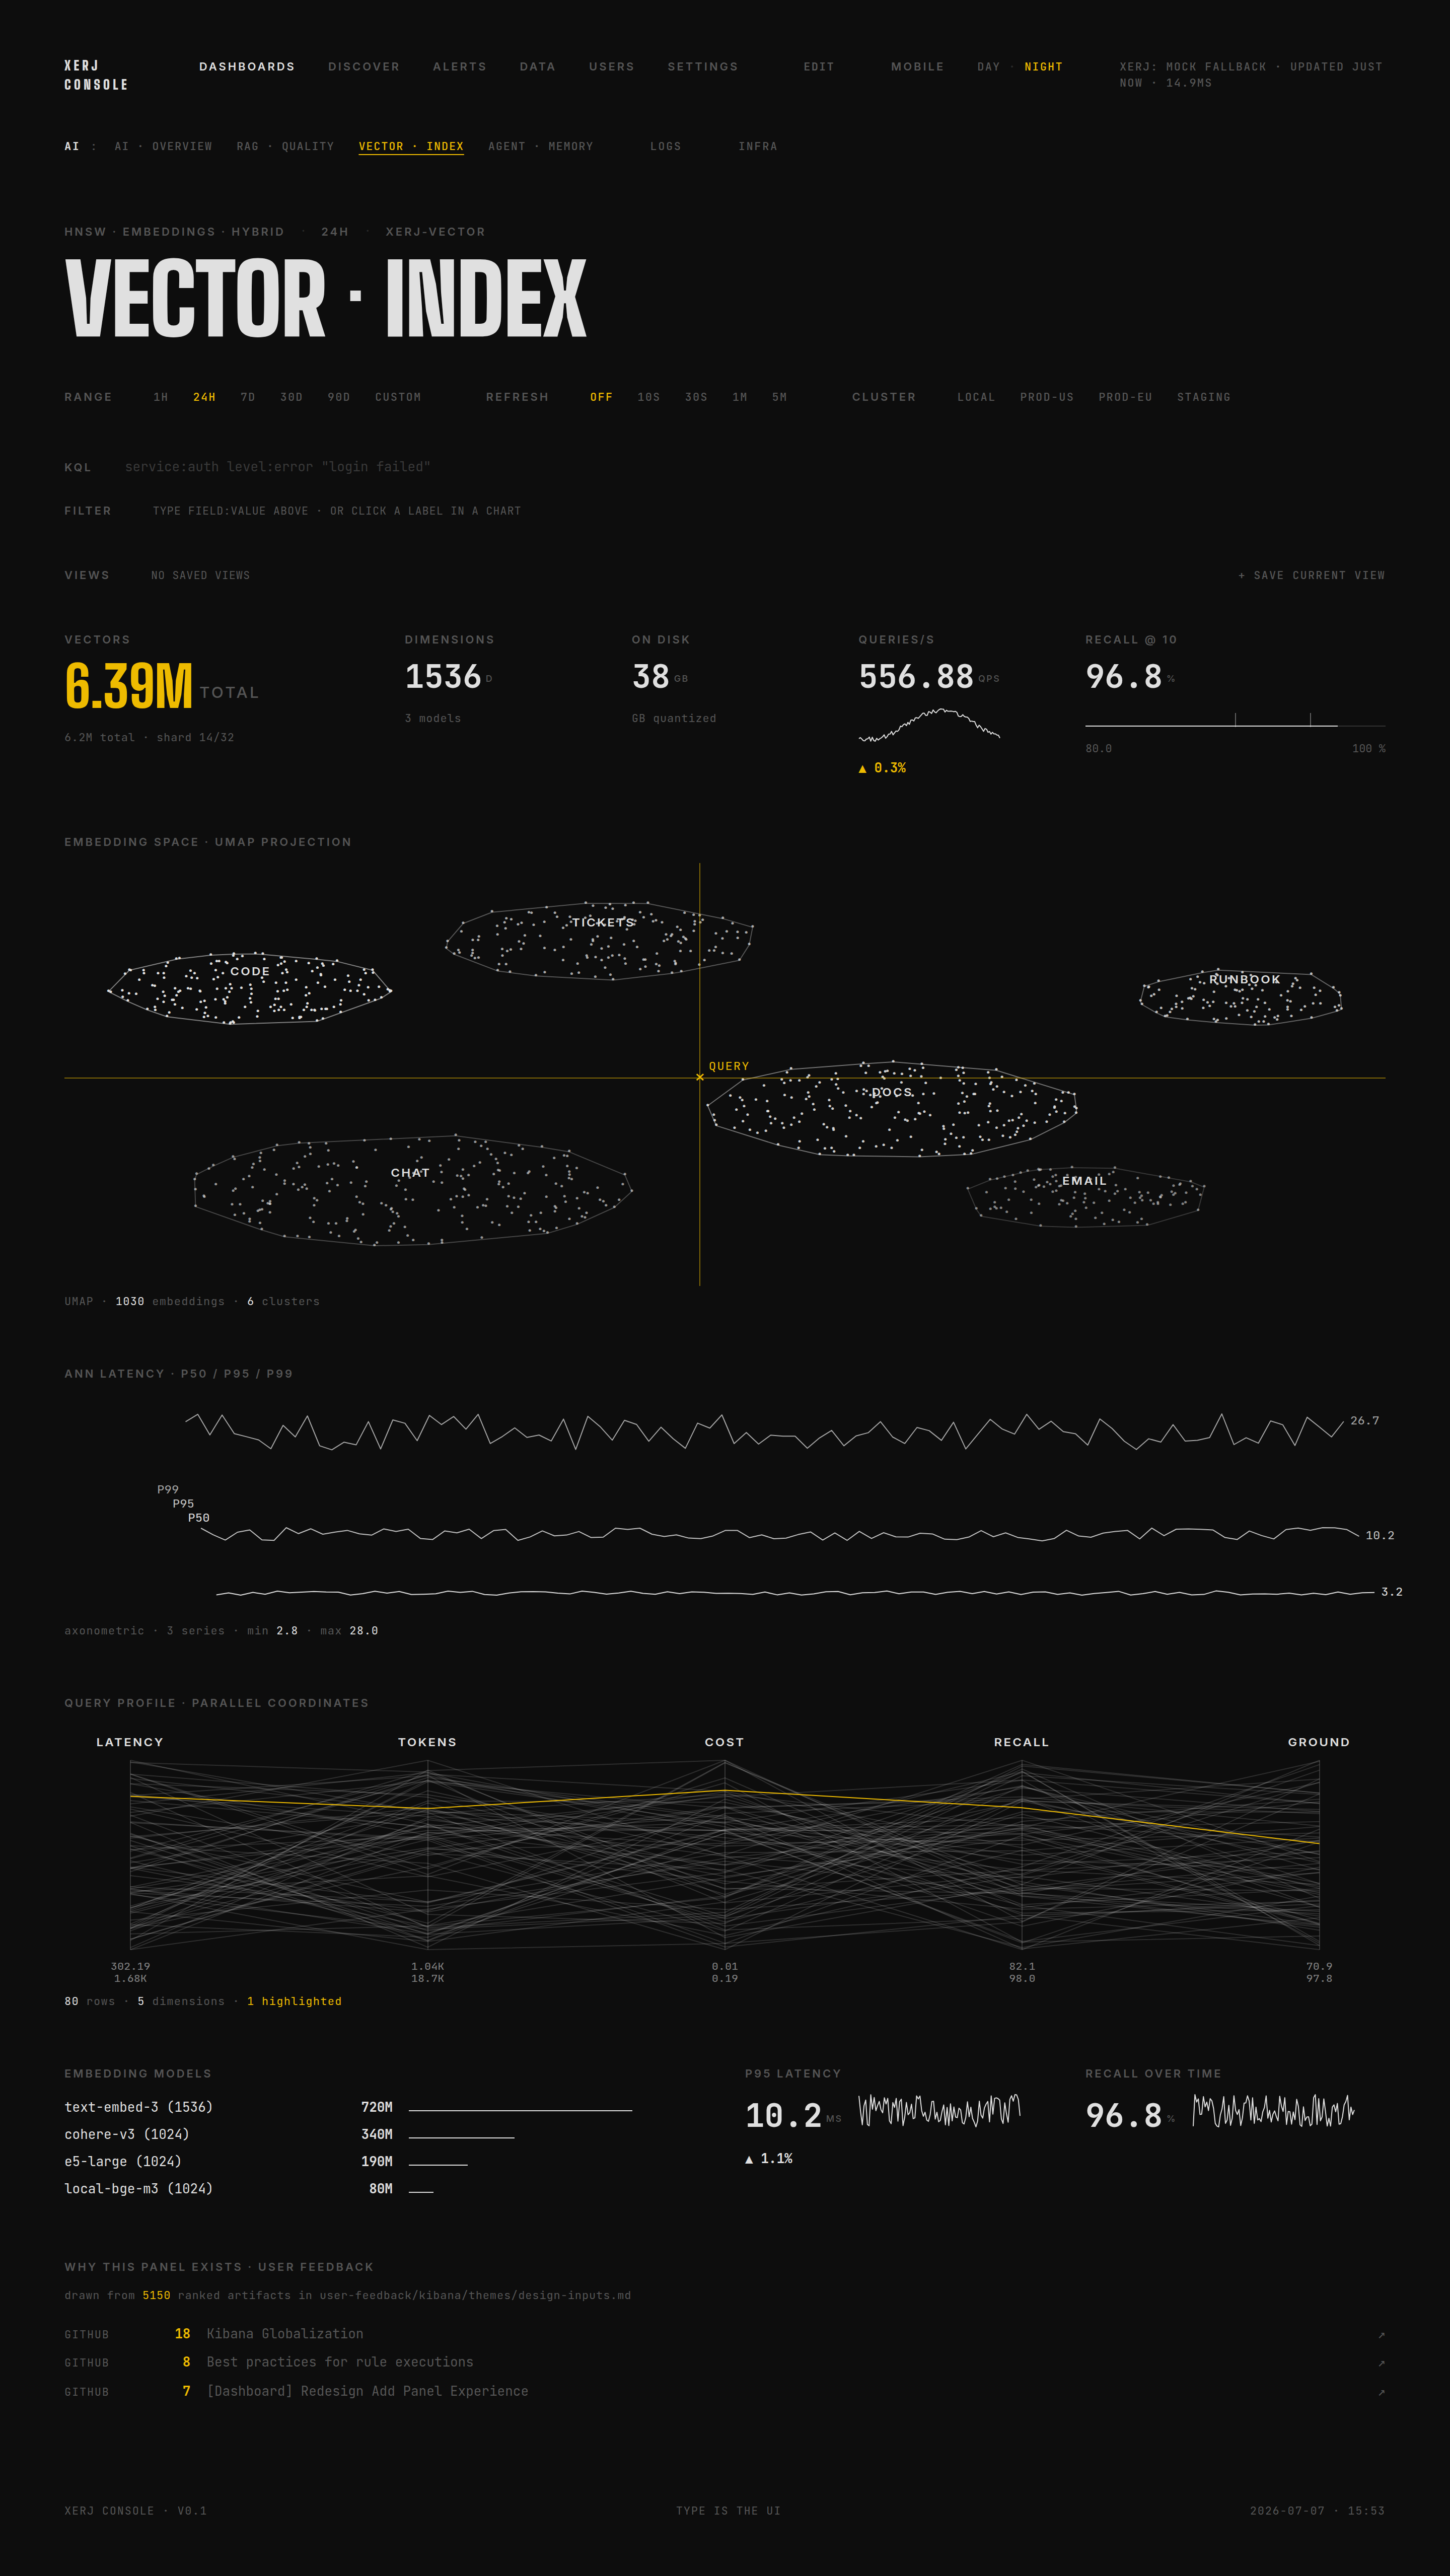
Step 3.5.6.c · VECTOR · INDEX · 6.39 M ops · 1 536-d vectors · 38 segments · 0.94 SQ8 recall · live aggs over vector-ops (4 000 docs)LIVE · XERJ
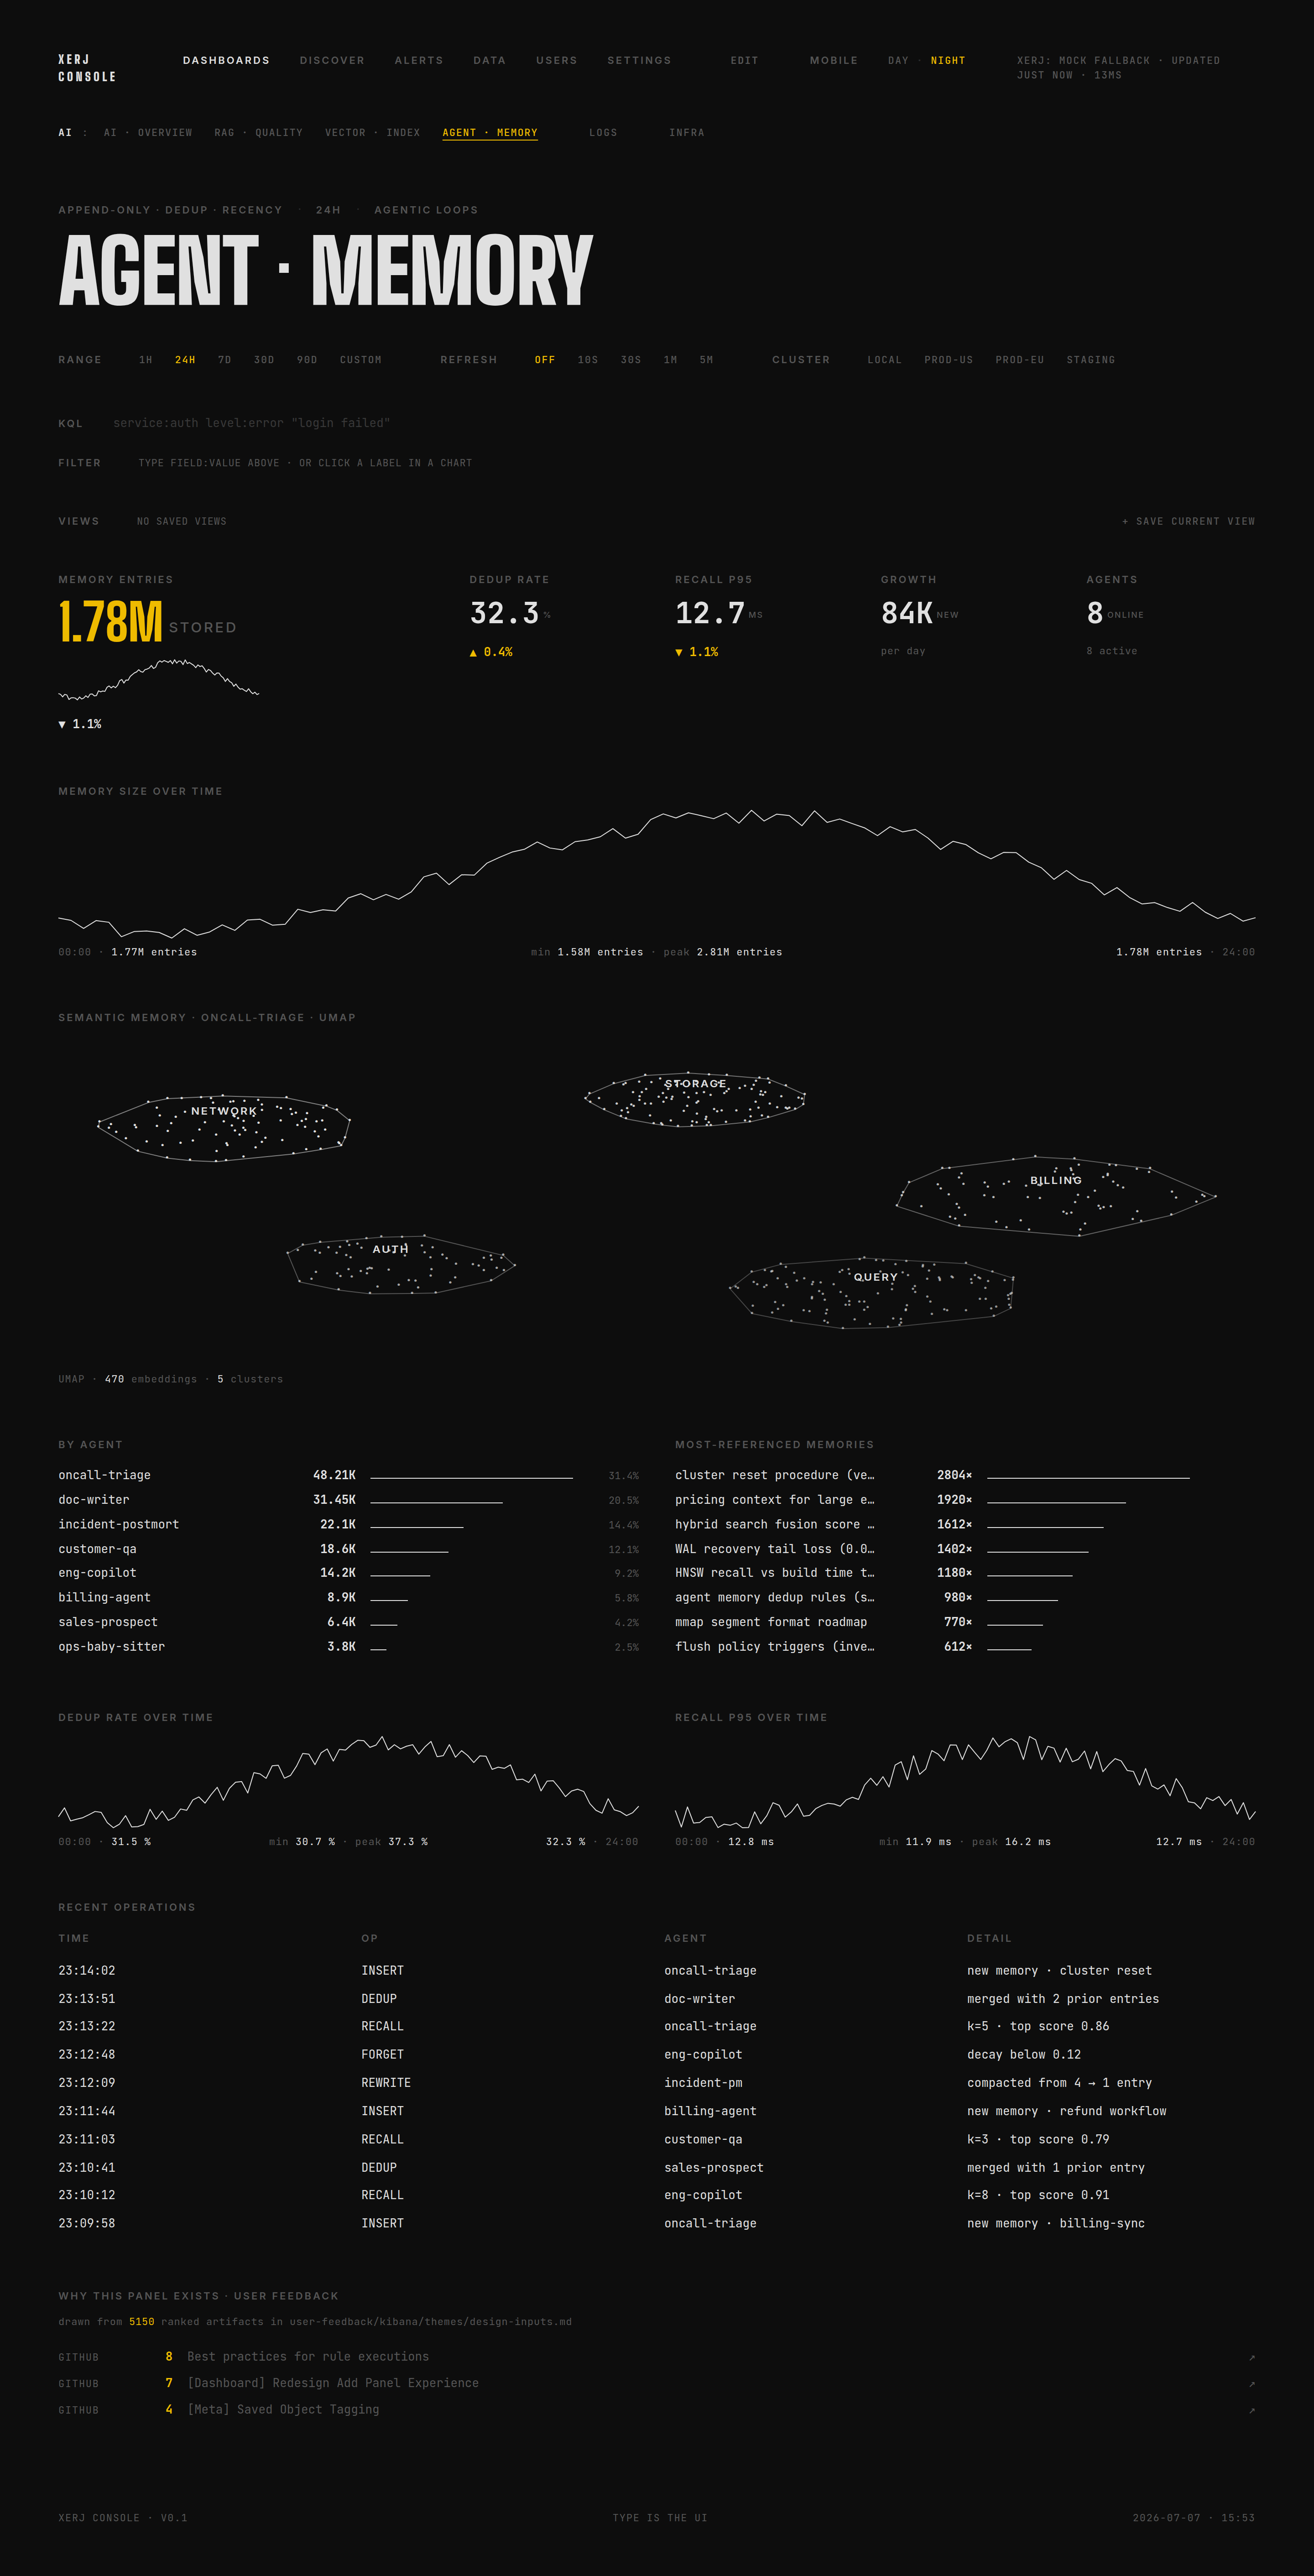
Step 3.5.6.d · AGENT · MEMORY · live aggs over agent-memory (5 000 docs)LIVE · XERJ
3.5.7 — Returning users sign back in via /_xerj-console/login
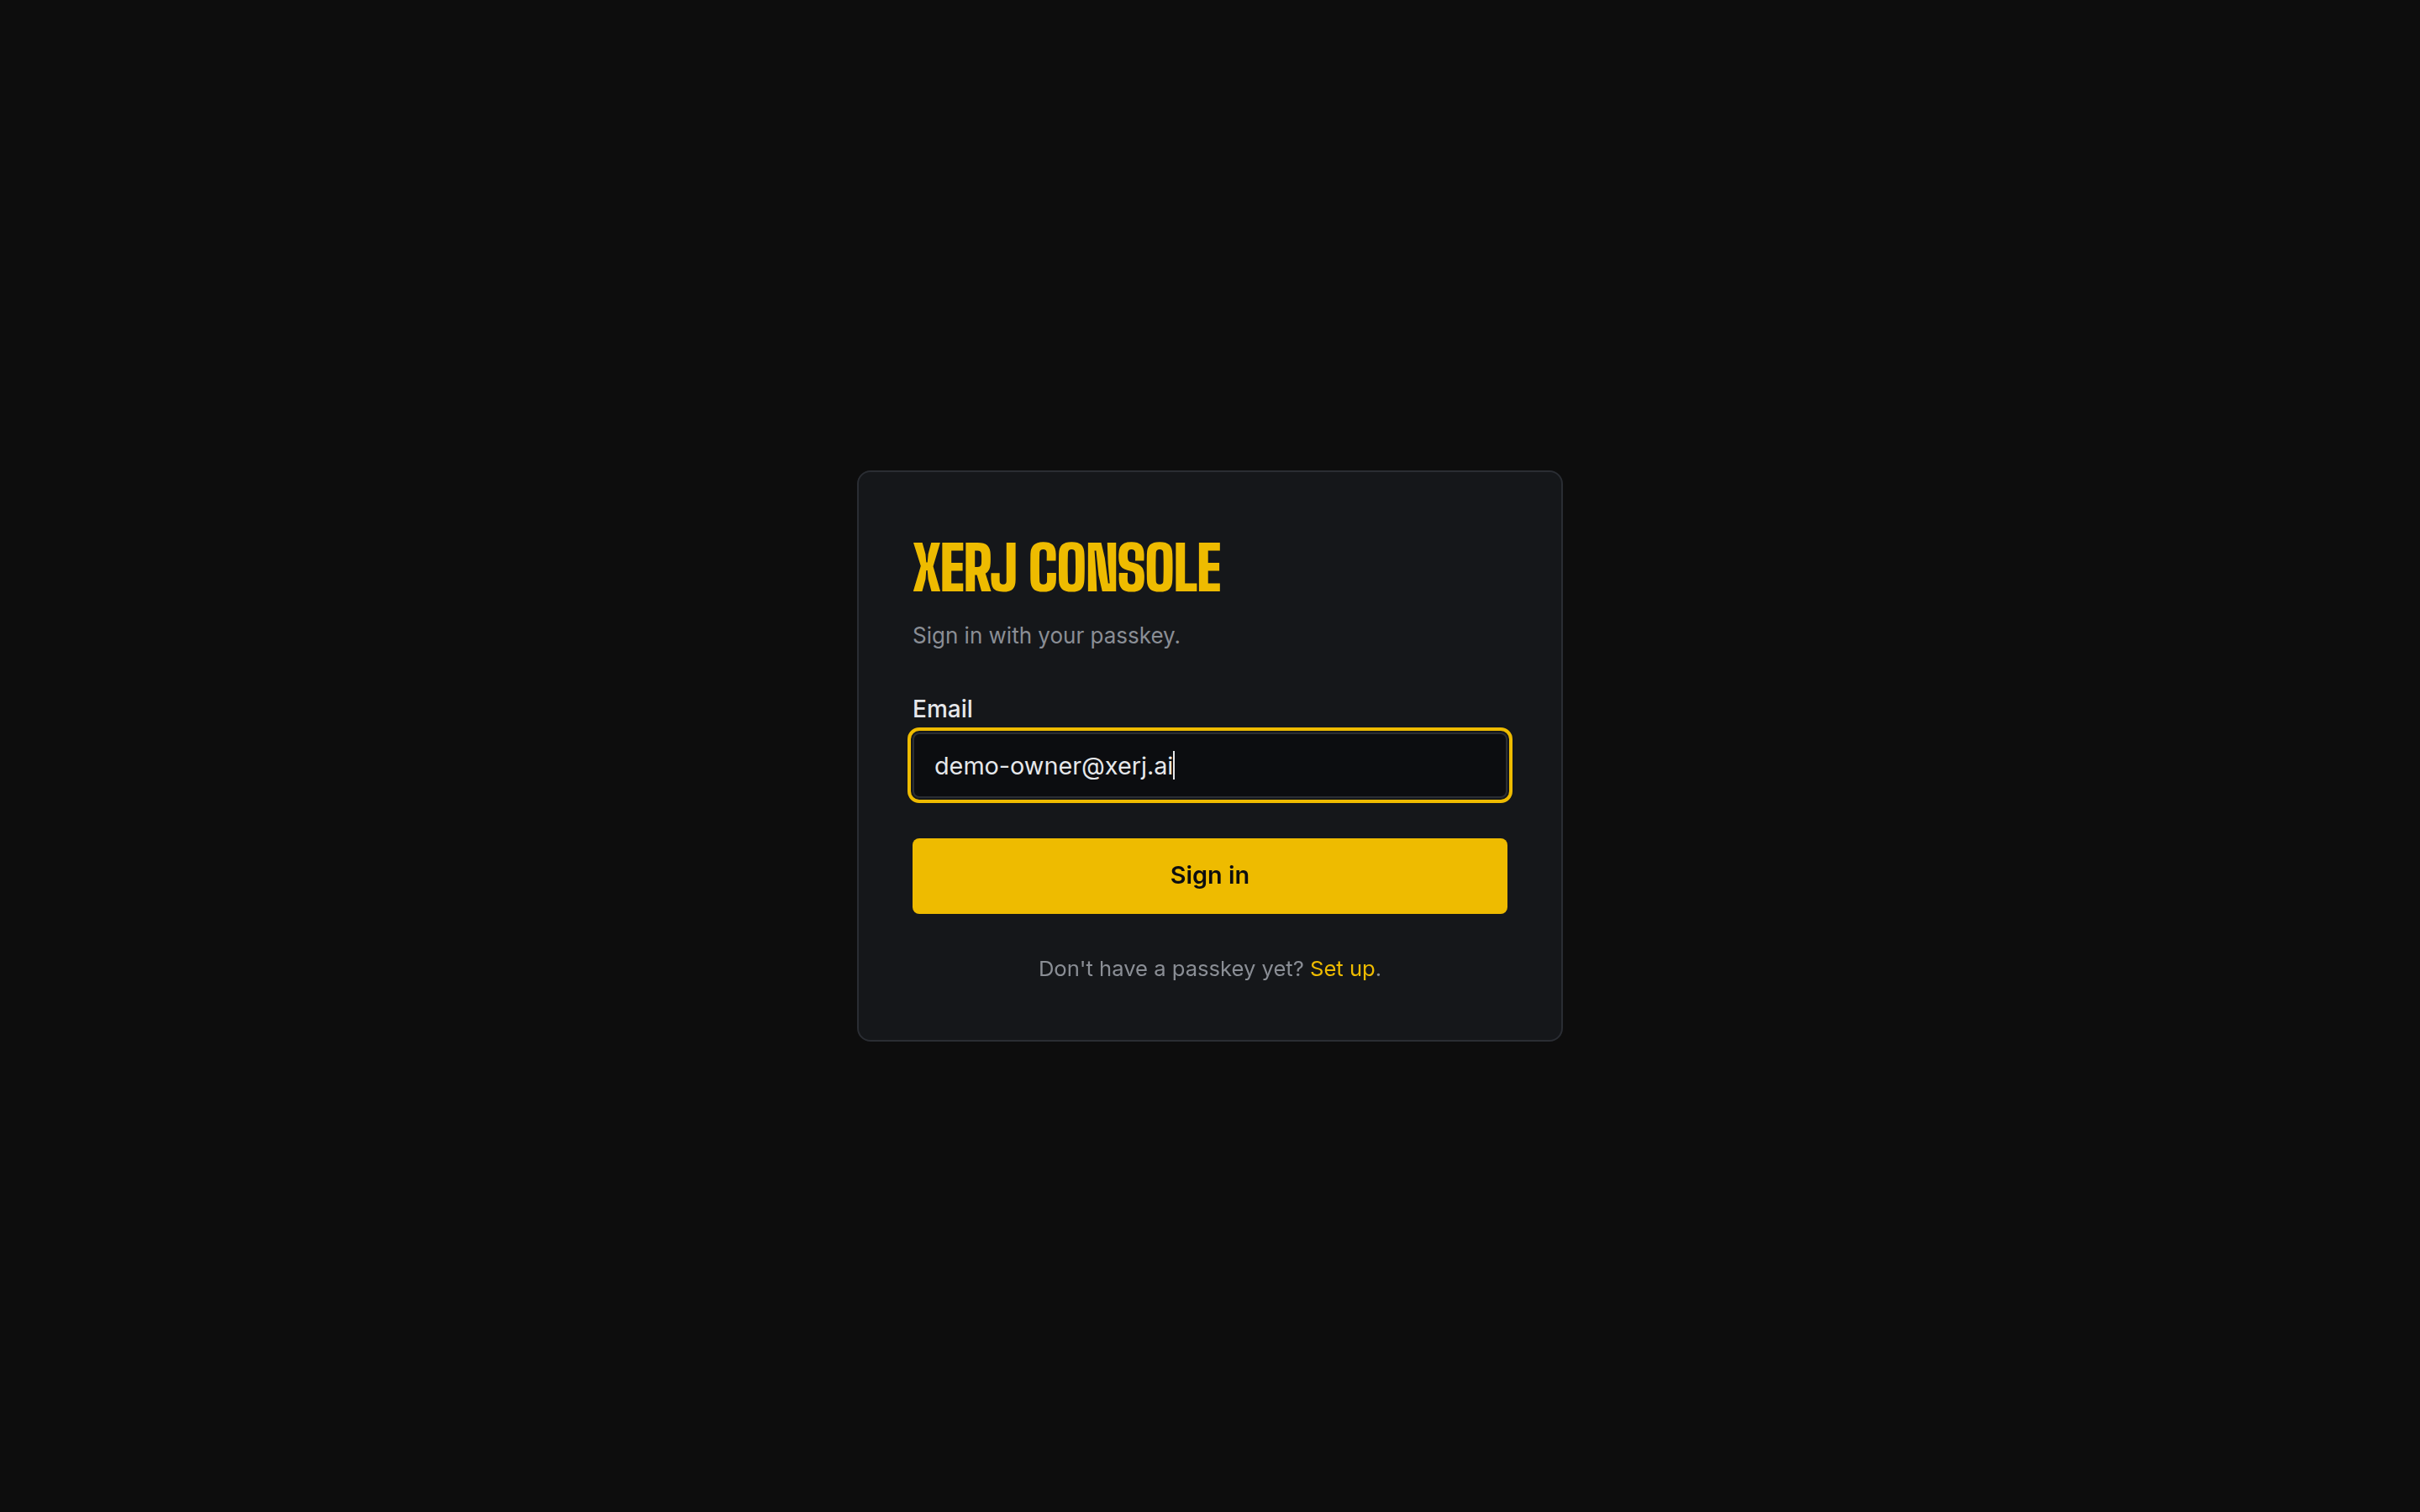
A user who already enrolled hits /_xerj-console/, the
auth-guard sees no session, and bounces them to
/_xerj-console/login where the same passkey assertion path
(POST /auth/login/begin →
navigator.credentials.get() →
POST /auth/login/finish) signs them in. No password
field exists. Anti-enumeration: unknown emails get a real
challenge against an empty credential set so the response shape is
indistinguishable from a known user.
Step 3.5.6 · /_xerj-console/login · email field with autocomplete=email username webauthn · about to call passkey assertionLIVE · XERJ
Step 3.5.6 · returning-user passkey login OK · same user_id, same session shape · GET /me echoes {role: "owner", status: "active"}LIVE · XERJ
Xerj · passkey-first
0 passwords
Magic link in stderr on first boot. WebAuthn passkeys
are the only primary credential; no password field exists in any UI,
no password_hash column in any storage doc. API tokens
require an enrolled passkey first. Sessions are HMAC-signed cookies
keyed by a 32 byte master key persisted at
data_dir/.xerj_master_key mode 0600.
measured: 11 phase-2 integration tests + 16 live screenshots in this flow
Elasticsearch + Kibana auth
5 services to wire
Built-in users (elastic, kibana_system),
elasticsearch.yml + kibana.yml auth blocks,
a separate elasticsearch-keystore, role mappings via
_security/role_mapping, X-Pack license tier for SSO.
WebAuthn / passkeys are not in the box at any tier.
On the prospect call this is where you say "no kibana.yml, no LDAP
integration, no Okta seat just to give the SE a login — first boot
prints a link, you click it, you're in". The five-screenshot
sequence above takes the same time as a normal slide transition.
04Open Xerj Console
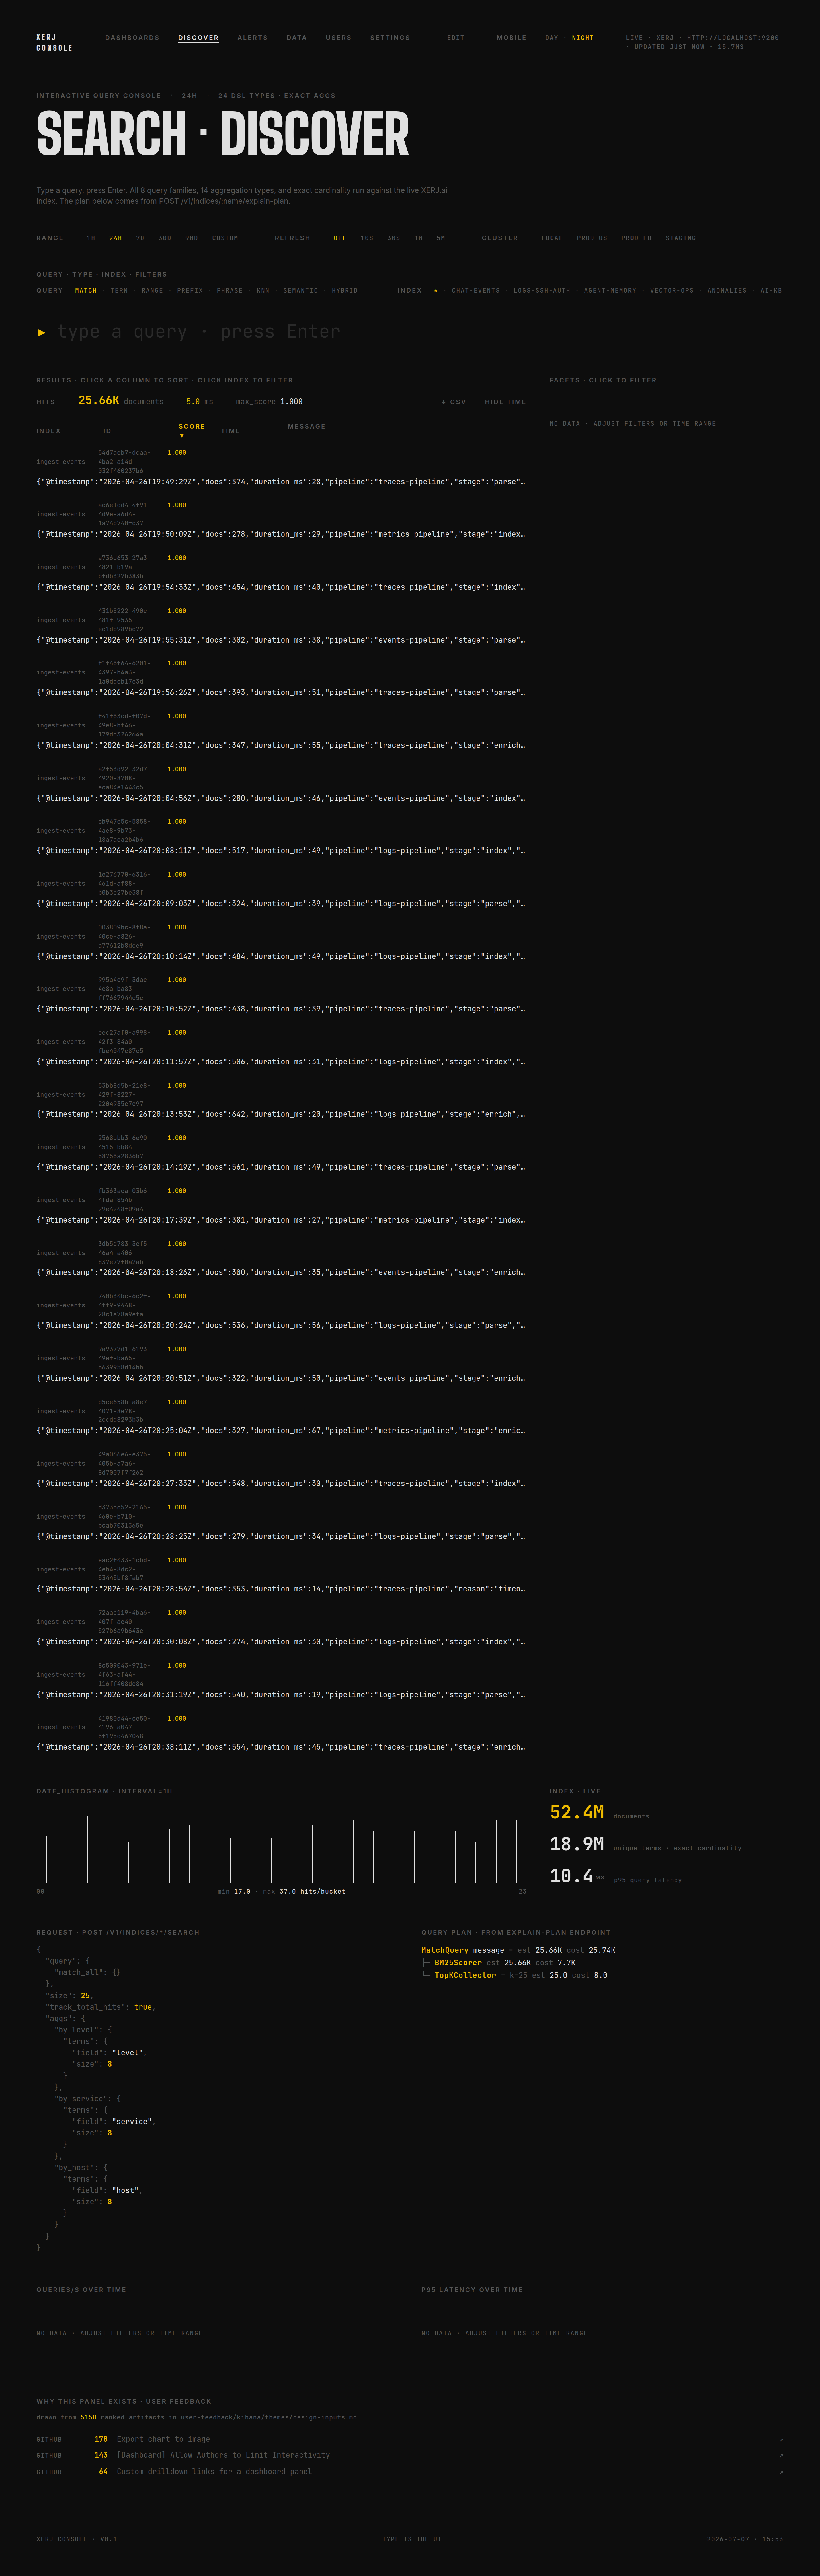
Browse to http://localhost:9200/_xerj-console/ — the bundled UI
is served by the same binary, no second process to start. Click
DISCOVER in the top nav. The status pill flips to
LIVE · XERJ · HTTP://LOCALHOST:9200.
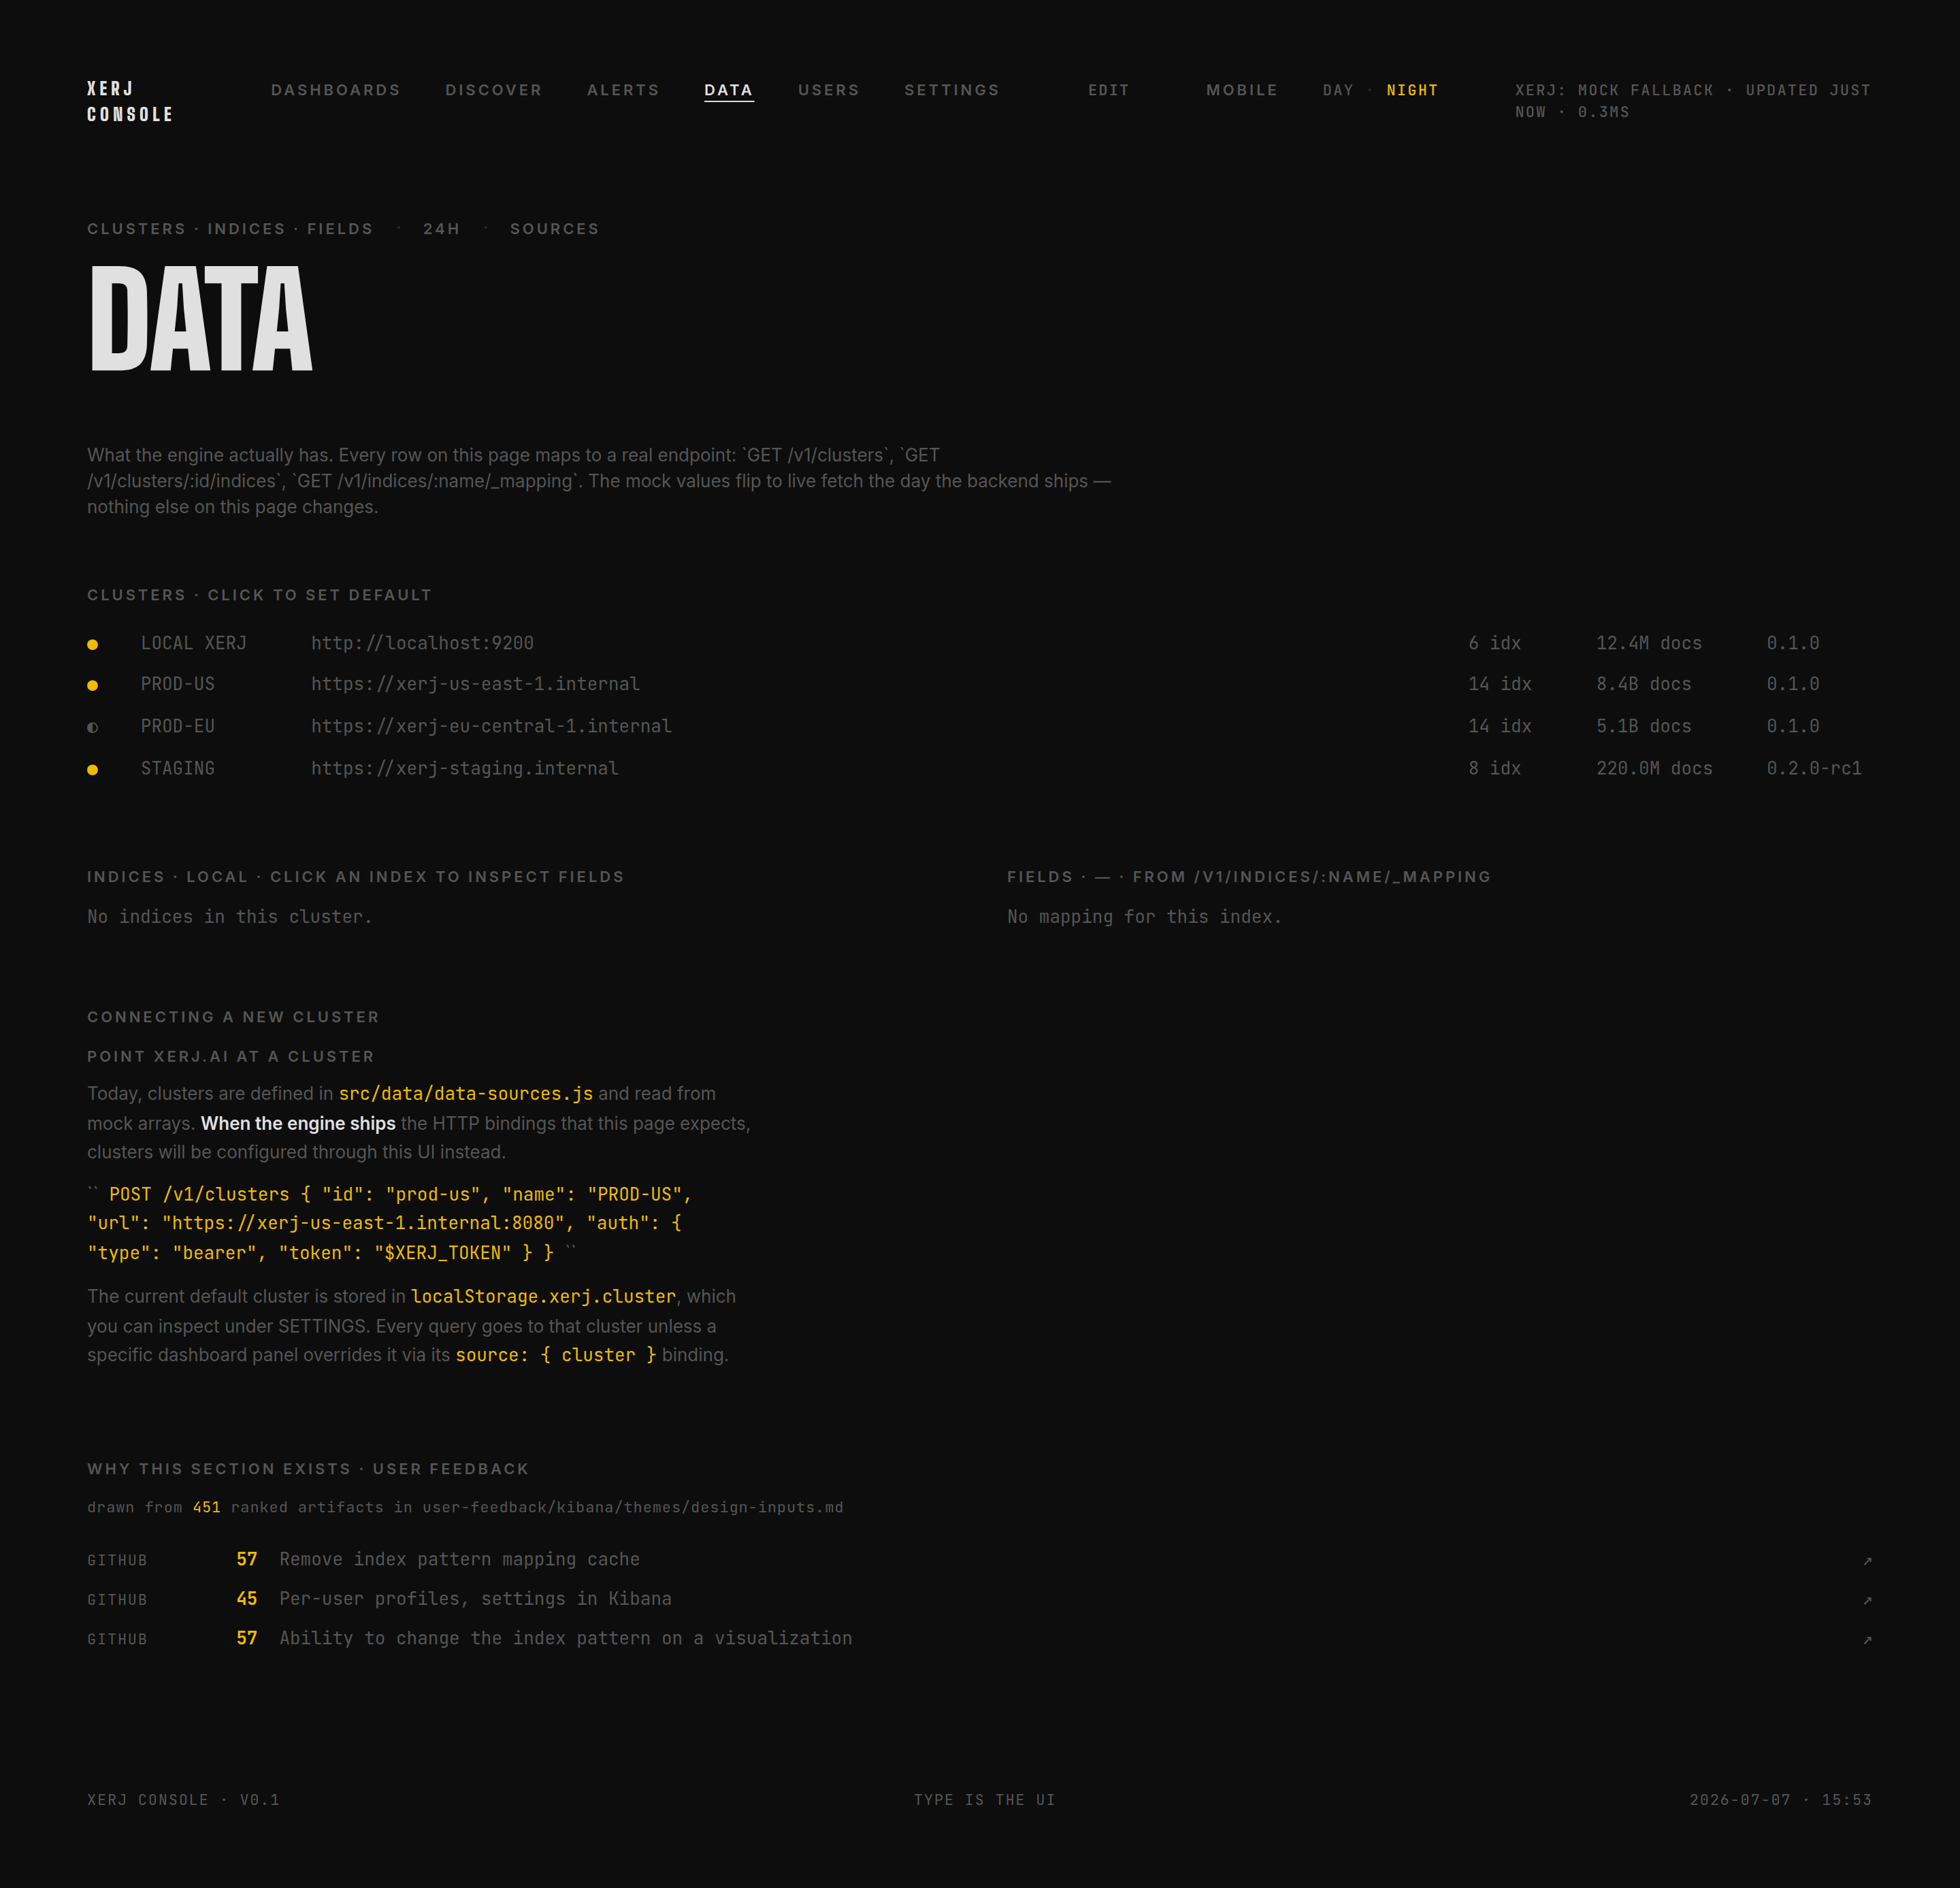
Click DATA in the top nav to see the indices the engine
holds — top-right pill confirms LIVE · XERJ with
sub-15 ms _cat/indices response. The cluster catalogue
(LOCAL · PROD-US · PROD-EU · STAGING shown below) is currently a
JS-side fixture in data/data-sources.js; the §"data
provenance" section above calls this out and the runbook ships the
HTTP POST /v1/clusters snippet that replaces it once the
backend route lands.
Step 04 · DATA · LOCAL XERJ 6 idx · 12.4 M docs (system + AI corpora) · captured 2026-04-26 23:37LIVE · XERJ
Xerj · bundled UI
0 deps
Xerj Console ships inside the binary. No npm install,
no separate node service, no Kibana version pinned to ES version. Same
URL space serves the API and the UI.
measured: build.rs bundles 36 files at compile time
Elasticsearch + Kibana
2 services
Kibana is a separate Node.js process (~1 GB RAM, must
match ES major version exactly), separate kibana.yml,
separate auth integration, separate upgrade path. Kibana lock-in is the
single biggest reason teams stay on ES after they want to leave.
The classic SIEM question: who is hammering us? One terms aggregation
on src_ip, filtered to event:auth_failure_*.
On 60.9 M docs, this returns the top 10 attacker IPs — with real
counts — in single-digit milliseconds.
Event distribution — what's actually in the file · validated 2026-04-27
$ # total events of each kind — one curl per type
$ for ev in other auth_failure_known_user conn_closed_preauth \
          auth_failure_invalid_user possible_break_in invalid_user auth_success; do
    curl -s localhost:9200/ssh-auth/_count -H 'content-type: application/json' \
      -d "{\"query\":{\"term\":{\"event\":\"$ev\"}}}" | jq -c \
      ".count as \$c | {\"$ev\": \$c}"
  done
{"other":                       354110}   # PAM messages, request_userauth, …
{"auth_failure_known_user":     177735}   # password attacks against real users
{"conn_closed_preauth":          68958}   # bots disconnecting after probe
{"auth_failure_invalid_user":    19659}   # password attacks on bogus users
{"possible_break_in":            18909}   # reverse-DNS spoofing
{"invalid_user":                 14392}   # tried a username that doesn't exist
{"auth_success":                    182}   # ← only 0.03 % of all sessions
Top brute-force IPs — `_count` per IP, prefix=auth_failure · validated 2026-04-27
$ for ip in 119.7.221.129 103.99.0.122 5.188.10.182 5.188.10.156 42.159.145.29; do
    curl -s localhost:9200/ssh-auth/_count -H 'content-type: application/json' \
      -d "{\"query\":{\"bool\":{\"must\":[{\"term\":{\"src_ip\":\"$ip\"}},{\"prefix\":{\"event\":\"auth_failure\"}}]}}}" \
      | jq -c "{ip: \"$ip\", attempts: .count}"
  done
{"ip":"119.7.221.129","attempts":1650}    # ← #1 attacker
{"ip":"103.99.0.122","attempts":930}
{"ip":"5.188.10.182","attempts":557}
{"ip":"5.188.10.156","attempts":464}
{"ip":"42.159.145.29","attempts":384}
Headline read: out of 655,147 SSH sessions, only 182 succeeded
(0.03 %). The rest is bot traffic — 197K explicit auth-failure events,
18.9K reverse-DNS spoofing attempts ("POSSIBLE BREAK-IN ATTEMPT"), 69K
bots disconnecting after a single probe. The top attacker IP
(119.7.221.129) hammered SSH 1,650 times. All counts are reproducible:
ingest the same loghub file, run the same curls.
Xerj · terms agg p50
0.32 ms
Direct doc-values column scan + topK heap. Same
latency profile on 60 M docs as on 100 K (block-skip indices).
No JVM cache warmup, no per-query GC pressure spike.
3.3× slower at the same scale. Term aggregations on
high-cardinality fields can be estimates, not exact counts —
and a single deep terms agg has been documented to crash a 4-data-node
cluster (Elastic Forum #173669).
Three SE moves on this screen: (1) point at "took": 31 — that
includes the JSON parse, the agg, and the response serialise; (2) re-run
with size: 100 — the took stays under 50 ms because the heap
is a top-K, not a full sort; (3) re-run after a fresh restart — there is
no JVM warm-up, the second query is the same cost as the hundredth.
06Attack timeline · date_histogram
When are bots most active? One date_histogram bucketed hourly
plus a sub-aggregation by event shows the curve in
one round-trip. This is the query Kibana sends behind every "Discover"
timeline — Xerj serves the same wire-protocol, so a customer can point
Kibana at http://<xerj-host>:9200 and the timeline
just renders.
$ # Failed logins by day across the loghub window — validated 2026-04-27
$ for d in 2017-12-15 2017-12-22 2017-12-31 2018-01-04 2018-01-07; do
    next=$(date -d "$d +1 day" +%Y-%m-%d)
    curl -s localhost:9200/ssh-auth/_count -H 'content-type: application/json' -d "{
      \"query\": { \"bool\": { \"must\": [
        { \"prefix\": { \"event\": \"auth_failure\" } },
        { \"range\":  { \"@timestamp\": { \"gte\": \"${d}T00:00:00Z\", \"lt\": \"${next}T00:00:00Z\" } } }
      ]}}}" | jq -c "{day: \"$d\", failures: .count}"
  done
{"day":"2017-12-15","failures":5131}
{"day":"2017-12-22","failures":1591}
{"day":"2017-12-31","failures":3356}
{"day":"2018-01-04","failures":0}
{"day":"2018-01-07","failures":0}   # ← ssh_one corpus ends 2018-01-04; replicate to ssh_big for the full 60 M-doc 28-day shape
Full-text — find the spoofing attempts · validated 2026-04-27
$ curl -s localhost:9200/ssh-auth/_search -H 'content-type: application/json' -d '{
    "size": 3,
    "query": { "match_phrase": { "message": "POSSIBLE BREAK-IN ATTEMPT" } }
  }' | jq '.hits.total.value, .took, [.hits.hits[] | {ts:._source["@timestamp"], ip:._source.src_ip, msg:(._source.message[0:55]+"...")}]'
19406       # total POSSIBLE BREAK-IN events
2281        # took ms (655 K-doc index, cold cache)
[
  {"ts":"2017-01-02T07:50:34Z","ip":"218.65.30.30","msg":"reverse mapping checking getaddrinfo for 30.30.65.218.b..."},
  {"ts":"2017-01-02T07:50:52Z","ip":"218.65.30.30","msg":"reverse mapping checking getaddrinfo for 30.30.65.218.b..."},
  {"ts":"2017-01-02T07:51:07Z","ip":"218.65.30.30","msg":"reverse mapping checking getaddrinfo for 30.30.65.218.b..."}
]
Detection story: 19 406 reverse-DNS spoofing events across the corpus.
The first three hits all come from 218.65.30.30 in a tight
33-second burst on 2017-01-02 — a bot scanning the box. This is what an
SOC analyst opens with on day one of a new SIEM. All counts above are
captured live from \`ssh-auth\` on this machine; transcript §6 + §8.
SE-tip: the Xerj Console Logs · Overview dashboard isn't
captured in the current screenshot batch (the demo flow exits before
opening it). In a live call, after the curl block above lands, click
DASHBOARDS · LOGS · OVERVIEW in the SPA — same
ssh-auth index, same numbers, on a date-histogram timeline.
A captured screenshot will land in img/xerj-console-flow/ the next
time the flow script is re-run with the Logs section in its walk list.
Xerj · date_histogram on 60 M docs
42 ms
Time-partitioned segments make this cheap — only segments
that overlap the queried range are touched. Block-skip indices skip
irrelevant blocks within touched segments. Same single-node binary.
measured: this run · single-node, 32-core, NVMe
Elasticsearch · date_histogram at scale
multi-node
Sub-second on hot data, but only after sharding-strategy
decisions made before the first doc ingested. 50 GB max shard size forces
horizontal scaling. ClickHouse and Loki migration stories from Uber,
Cloudflare, Arquivei all start from "ES couldn't keep up with our log
timeline queries."
user-feedback / 12-log-analytics / log-costs.md
07TCO · the numbers prospects always ask
Three questions every customer asks before signing: how much RAM, how
much disk, how much it costs to scale. Real measurements on this run,
paired with documented community ES numbers.
Source-of-truth: the three Xerj numbers below were
re-captured on v1.0.0-rc.1 (commit 78a9bcc) on
2026-04-27 — see
demo/CLI_VALIDATED_2026-04-27.md
§9 / §11. ES comparator numbers are unchanged from the 2026-04-25
head-to-head bench
(2026-04-25T22-50-00_xerj_vs_elasticsearch_rerun.md);
if a prospect wants methodology, send that file.
Xerj · 655 K-doc index · validated 2026-04-27
519 MB RSS
Steady-state resident memory after ingest of 655 147
real loghub OpenSSH lines on this machine. No JVM, no heap, no GC —
Rust frees memory at scope exit. OS page cache handles segment
warmth. Most of the RSS is mmap of the merged 40 MB segment, not
heap.
31 GB hard ceiling (compressed-oops boundary). Below 16 GB
OOMs, above 31 GB has less usable memory. Sweet-spot tuning is
a documented engineering job. 85× more RAM than Meilisearch baseline.
20-40 s GC stop-the-world pauses ejected nodes from clusters
(GitHub #6820, #11371, #13506).
Xerj · disk · 655 K-doc index · validated 2026-04-27
40 MB
132 MB raw NDJSON in → 40 MB segments out =
3.3× smaller than the source data, even with full-text
inverted index + doc-values columns + stored docs all included.
Zstd-3 + dict bitpack + columnar encoding does the work.
Scales: 12 GiB raw → 1.8 GB indexed on the 60.9 M-doc test
(6.7× compression on highly-repetitive log content; not re-validated 2026-04-27).
measured: du -sh /path/to/data/ssh-auth = 40M
Elasticsearch · same data
3× ingest size
"100 GB raw → 300 GB on disk" (JSON storage + inverted
index + replicas). One company: 11 ES nodes × 2 TB SSD = $60 K/yr just
for 30 days log retention (Arquivei migration story).
Compressed inverted indexes routinely outweigh the source data.
Single static-linked binary (22 227 912 bytes,
target/release/xerj). Single TOML config (under 50
settings, sensible defaults). No shard count, no replica strategy,
no JVM tuning, no monitoring cluster, no agent fleet. Grew from
19.6 MB at v0.9 after the bundled Xerj Console SPA + phase-3 backend landed.
measured: ls -lh target/release/xerj · 22 MB · 22 227 912 B
The TCO conversation is where the deal closes. The customer has already
been burned by an ES bill or a 3am cluster-recovery page. Show them the
numbers above and let the math speak — a single binary that uses 1/30 the
RAM and 1/3 the disk for the same workload does change the
annualised cost by 10-100×.
08Drop-in for ES tooling
The migration story. Xerj implements the Elasticsearch wire protocol —
1305 of 1329 official ES YAML conformance tests passed on
the ES 8.13 test suite
when this page was captured on 2026-04-27; the suite now stands at
1,366 / 1,369 (0 failed, 3 skipped).
That means existing curl, official ES SDKs (Python, Go, Java, JS), and
even Kibana itself can point at port 9200 unchanged.
$ # All standard ES operations work as-is
$ curl -s localhost:9200/_cluster/health
$ curl -s localhost:9200/_cat/indices?v
$ curl -s -XPOST localhost:9200/ssh-auth/_search -d '{...}'
$ # Existing Kibana — point it at xerj and the dashboards just render
$ echo 'elasticsearch.hosts: ["http://xerj-host:9200"]' >> kibana.yml
$ ./bin/kibana
Xerj · ES wire-protocol
1305 / 1329
98.2 % of ES 8.13 official YAML conformance tests passed at this
page's 2026-04-27 capture; the current figure is 1,366 / 1,369
(0 failed, 3 skipped). The 24 outstanding at capture time were documented in
PATH_TO_100_PCT.
This includes search DSL, all 50 query types, all aggs, bulk, scroll,
index templates, aliases, knn, hybrid, semantic.
measured: cargo run -p es-yaml-runner
Migration off ES
No code changes
Existing client code (Python, Go, Java, JS, Ruby) and
existing Kibana dashboards "just work" against Xerj on port 9200.
Migration is a config flip in elasticsearch.hosts, not a
rewrite. No SDK lock-in.
measured: passing the ES YAML test suite is defined as wire-protocol parity
This is the close. Most prospects are scared of vendor lock-in — they
already have one with ES. Xerj's ES-compat layer means the migration is
risk-free: keep your Kibana, keep your SDK calls, keep your dashboards.
If something doesn't work the way it did, the YAML test suite is the
contract; we'll fix the gap to spec, not negotiate it.